Portuguese vs Immigrants from Eastern Africa Single Mother Households

COMPARE

Portuguese
Race
Ancestry
AfghanAfricanAlaska NativeAlaskan AthabascanAlbanianAleutAlsatianAmericanApacheArabArapahoArgentineanArmenianAssyrian/Chaldean/SyriacAustralianAustrianBahamianBangladeshiBarbadianBasqueBelgianBelizeanBermudanBhutaneseBlackfeetBolivianBrazilianBritishBritish West IndianBulgarianBurmeseCajunCambodianCanadianCape VerdeanCarpatho RusynCelticCentral AmericanCentral American IndianCherokeeCheyenneChickasawChileanChineseChippewaChoctawColombianColvilleComancheCosta RicanCreeCreekCroatianCrowCubanCypriotCzechCzechoslovakianDanishDelawareDominicanDutchDutch West IndianEastern EuropeanEcuadorianEgyptianEnglishEstonianEthiopianEuropeanFijianFilipinoFinnishFrenchFrench American IndianFrench CanadianGermanGerman RussianGhanaianGreekGuamanian/ChamorroGuatemalanGuyaneseHaitianHmongHonduranHopiHoumaHungarianIcelanderIndian (Asian)IndonesianInupiatIranianIraqiIrishIroquoisIsraeliItalianJamaicanJapaneseJordanianKenyanKiowaKoreanLaotianLatvianLebaneseLiberianLithuanianLumbeeLuxembourgerMacedonianMalaysianMalteseMarshalleseMenomineeMexicanMexican American IndianMongolianMoroccanNative HawaiianNavajoNepaleseNew ZealanderNicaraguanNigerianNorthern EuropeanNorwegianOkinawanOsageOttawaPaiutePakistaniPalestinianPanamanianParaguayanPennsylvania GermanPeruvianPimaPolishPortuguesePotawatomiPuebloPuerto RicanPuget Sound SalishRomanianRussianSalvadoranSamoanScandinavianScotch-IrishScottishSeminoleSenegaleseSerbianShoshoneSierra LeoneanSiouxSlavicSlovakSloveneSomaliSouth AfricanSouth AmericanSouth American IndianSoviet UnionSpaniardSpanishSpanish AmericanSpanish American IndianSri LankanSubsaharan AfricanSudaneseSwedishSwissSyrianTaiwaneseThaiTlingit-HaidaTohono O'OdhamTonganTrinidadian and TobagonianTsimshianTurkishU.S. Virgin IslanderUgandanUkrainianUruguayanUteVenezuelanVietnameseWelshWest IndianYakamaYaquiYugoslavianYumanYup'ikZimbabwean
Immigration
NonimmigrantsImmigrantsAfghanistanAfricaAlbaniaArgentinaArmeniaAsiaAustraliaAustriaBahamasBangladeshBarbadosBelarusBelgiumBelizeBoliviaBosnia and HerzegovinaBrazilBulgariaBurma/MyanmarCabo VerdeCambodiaCameroonCanadaCaribbeanCentral AmericaChileChinaColombiaCongoCosta RicaCroatiaCubaCzechoslovakiaDenmarkDominicaDominican RepublicEastern AsiaEastern EuropeEcuadorEgyptEl SalvadorEnglandEritreaEthiopiaEuropeFijiFranceGermanyGhanaGreeceGrenadaGuatemalaGuyanaHaitiHondurasHong KongHungaryIndiaIndonesiaIranIraqIrelandIsraelItalyJamaicaJapanJordanKazakhstanKenyaKoreaKuwaitLaosLatin AmericaLatviaLebanonLiberiaLithuaniaMalaysiaMexicoMicronesiaMiddle AfricaMoldovaMoroccoNepalNetherlandsNicaraguaNigeriaNorth AmericaNorth MacedoniaNorthern AfricaNorthern EuropeNorwayOceaniaPakistanPanamaPeruPhilippinesPolandPortugalRomaniaRussiaSaudi ArabiaScotlandSenegalSerbiaSierra LeoneSingaporeSomaliaSouth AfricaSouth AmericaSouth Central AsiaSouth Eastern AsiaSouthern EuropeSpainSri LankaSt. Vincent and the GrenadinesSudanSwedenSwitzerlandSyriaTaiwanThailandTrinidad and TobagoTurkeyUgandaUkraineUruguayUzbekistanVenezuelaVietnamWest IndiesWestern AfricaWestern AsiaWestern EuropeYemenZaireZimbabweAzores
Immigrants from Eastern Africa
Race
Ancestry
AfghanAfricanAlaska NativeAlaskan AthabascanAlbanianAleutAlsatianAmericanApacheArabArapahoArgentineanArmenianAssyrian/Chaldean/SyriacAustralianAustrianBahamianBangladeshiBarbadianBasqueBelgianBelizeanBermudanBhutaneseBlackfeetBolivianBrazilianBritishBritish West IndianBulgarianBurmeseCajunCambodianCanadianCape VerdeanCarpatho RusynCelticCentral AmericanCentral American IndianCherokeeCheyenneChickasawChileanChineseChippewaChoctawColombianColvilleComancheCosta RicanCreeCreekCroatianCrowCubanCypriotCzechCzechoslovakianDanishDelawareDominicanDutchDutch West IndianEastern EuropeanEcuadorianEgyptianEnglishEstonianEthiopianEuropeanFijianFilipinoFinnishFrenchFrench American IndianFrench CanadianGermanGerman RussianGhanaianGreekGuamanian/ChamorroGuatemalanGuyaneseHaitianHmongHonduranHopiHoumaHungarianIcelanderIndian (Asian)IndonesianInupiatIranianIraqiIrishIroquoisIsraeliItalianJamaicanJapaneseJordanianKenyanKiowaKoreanLaotianLatvianLebaneseLiberianLithuanianLumbeeLuxembourgerMacedonianMalaysianMalteseMarshalleseMenomineeMexicanMexican American IndianMongolianMoroccanNative HawaiianNavajoNepaleseNew ZealanderNicaraguanNigerianNorthern EuropeanNorwegianOkinawanOsageOttawaPaiutePakistaniPalestinianPanamanianParaguayanPennsylvania GermanPeruvianPimaPolishPotawatomiPuebloPuerto RicanPuget Sound SalishRomanianRussianSalvadoranSamoanScandinavianScotch-IrishScottishSeminoleSenegaleseSerbianShoshoneSierra LeoneanSiouxSlavicSlovakSloveneSomaliSouth AfricanSouth AmericanSouth American IndianSoviet UnionSpaniardSpanishSpanish AmericanSpanish American IndianSri LankanSubsaharan AfricanSudaneseSwedishSwissSyrianTaiwaneseThaiTlingit-HaidaTohono O'OdhamTonganTrinidadian and TobagonianTsimshianTurkishU.S. Virgin IslanderUgandanUkrainianUruguayanUteVenezuelanVietnameseWelshWest IndianYakamaYaquiYugoslavianYumanYup'ikZimbabwean
Immigration
NonimmigrantsImmigrantsAfghanistanAfricaAlbaniaArgentinaArmeniaAsiaAustraliaAustriaBahamasBangladeshBarbadosBelarusBelgiumBelizeBoliviaBosnia and HerzegovinaBrazilBulgariaBurma/MyanmarCabo VerdeCambodiaCameroonCanadaCaribbeanCentral AmericaChileChinaColombiaCongoCosta RicaCroatiaCubaCzechoslovakiaDenmarkDominicaDominican RepublicEastern AfricaEastern AsiaEastern EuropeEcuadorEgyptEl SalvadorEnglandEritreaEthiopiaEuropeFijiFranceGermanyGhanaGreeceGrenadaGuatemalaGuyanaHaitiHondurasHong KongHungaryIndiaIndonesiaIranIraqIrelandIsraelItalyJamaicaJapanJordanKazakhstanKenyaKoreaKuwaitLaosLatin AmericaLatviaLebanonLiberiaLithuaniaMalaysiaMexicoMicronesiaMiddle AfricaMoldovaMoroccoNepalNetherlandsNicaraguaNigeriaNorth AmericaNorth MacedoniaNorthern AfricaNorthern EuropeNorwayOceaniaPakistanPanamaPeruPhilippinesPolandPortugalRomaniaRussiaSaudi ArabiaScotlandSenegalSerbiaSierra LeoneSingaporeSomaliaSouth AfricaSouth AmericaSouth Central AsiaSouth Eastern AsiaSouthern EuropeSpainSri LankaSt. Vincent and the GrenadinesSudanSwedenSwitzerlandSyriaTaiwanThailandTrinidad and TobagoTurkeyUgandaUkraineUruguayUzbekistanVenezuelaVietnamWest IndiesWestern AfricaWestern AsiaWestern EuropeYemenZaireZimbabweAzores
Single Mother Households
Income
Poverty
Unemployment
Labor Participation
Family Structure
Vehicle Availability
Education Level
Disability

Single Mother Households Comparison

Portuguese

Immigrants from Eastern Africa

Fair
Tragic
6.4%
SINGLE MOTHER HOUSEHOLDS
40.0/ 100
METRIC RATING
178th/ 347
METRIC RANK
6.8%
SINGLE MOTHER HOUSEHOLDS
4.4/ 100
METRIC RATING
218th/ 347
METRIC RANK

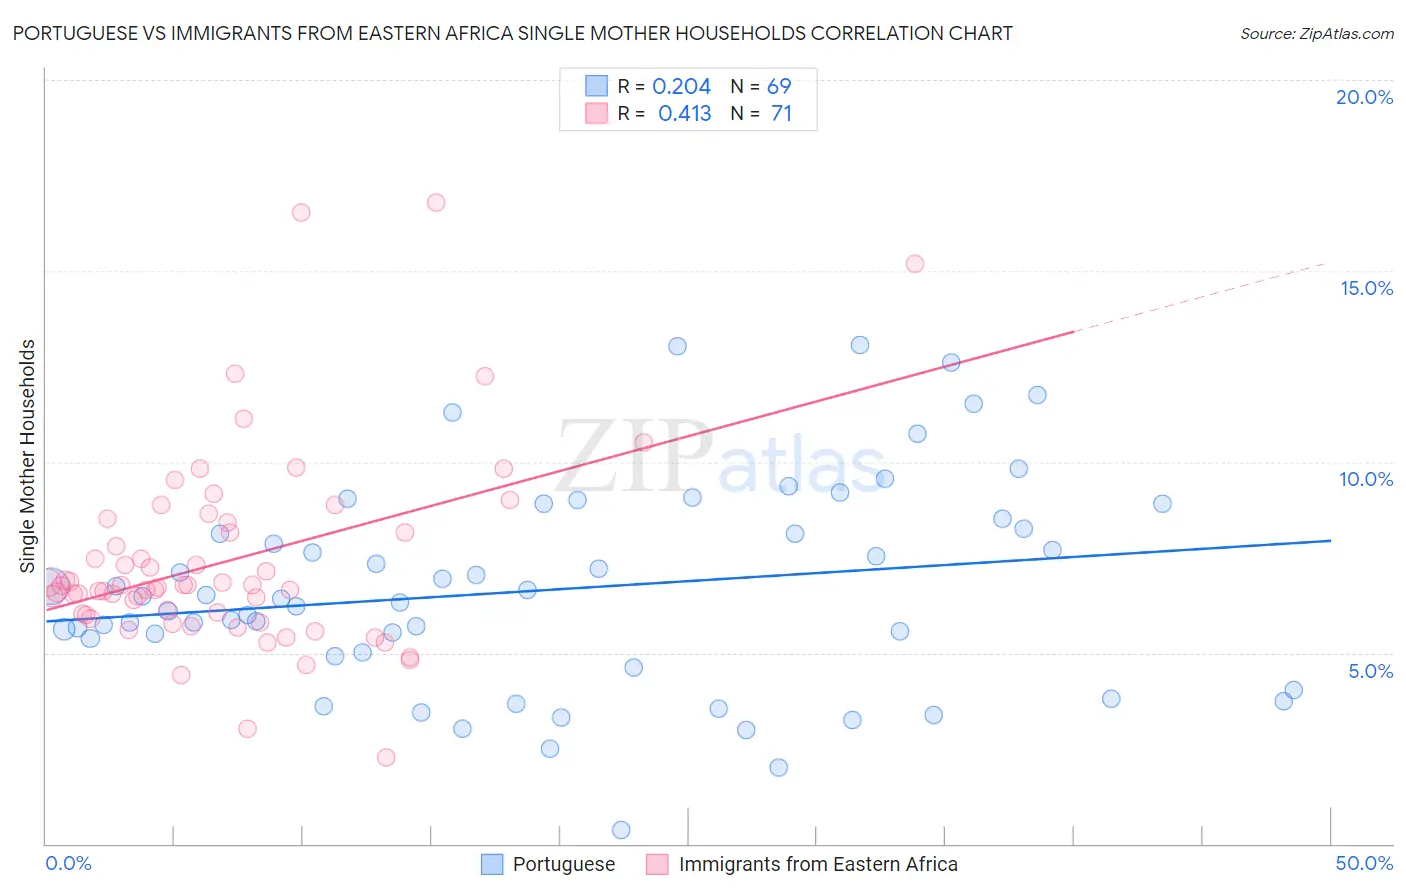
Portuguese vs Immigrants from Eastern Africa Single Mother Households Correlation Chart

The statistical analysis conducted on geographies consisting of 448,231,637 people shows a weak positive correlation between the proportion of Portuguese and percentage of single mother households in the United States with a correlation coefficient (R) of 0.204 and weighted average of 6.4%. Similarly, the statistical analysis conducted on geographies consisting of 354,507,775 people shows a moderate positive correlation between the proportion of Immigrants from Eastern Africa and percentage of single mother households in the United States with a correlation coefficient (R) of 0.413 and weighted average of 6.8%, a difference of 7.2%.
Portuguese vs Immigrants from Eastern Africa Single Mother Households

Single Mother Households Correlation Summary

MeasurementPortugueseImmigrants from Eastern Africa
Minimum0.35%2.3%
Maximum13.1%16.8%
Range12.7%14.5%
Mean6.7%7.4%
Median6.4%6.8%
Interquartile 25% (IQ1)5.0%6.0%
Interquartile 75% (IQ3)8.4%8.4%
Interquartile Range (IQR)3.4%2.4%
Standard Deviation (Sample)2.7%2.6%
Standard Deviation (Population)2.7%2.6%

Similar Demographics by Single Mother Households

Demographics Similar to Portuguese by Single Mother Households

In terms of single mother households, the demographic groups most similar to Portuguese are Hmong (6.4%, a difference of 0.020%), Osage (6.4%, a difference of 0.34%), Immigrants from Nepal (6.4%, a difference of 0.45%), Immigrants from Bosnia and Herzegovina (6.3%, a difference of 0.49%), and Marshallese (6.3%, a difference of 0.65%).
DemographicsRating | RankSingle Mother Households
Afghans
52.5
/100
|
#171
Average
6.3%
Immigrants | South Eastern Asia
52.2
/100
|
#172
Average
6.3%
Immigrants | Vietnam
51.5
/100
|
#173
Average
6.3%
Immigrants | Morocco
50.0
/100
|
#174
Average
6.3%
Marshallese
45.8
/100
|
#175
Average
6.3%
Immigrants | Bosnia and Herzegovina
44.3
/100
|
#176
Average
6.3%
Osage
43.0
/100
|
#177
Average
6.4%
Portuguese
40.0
/100
|
#178
Fair
6.4%
Hmong
39.8
/100
|
#179
Fair
6.4%
Immigrants | Nepal
36.1
/100
|
#180
Fair
6.4%
Spanish
33.4
/100
|
#181
Fair
6.4%
South American Indians
33.4
/100
|
#182
Fair
6.4%
Spaniards
27.8
/100
|
#183
Fair
6.5%
Ethiopians
26.0
/100
|
#184
Fair
6.5%
Ugandans
25.6
/100
|
#185
Fair
6.5%

Demographics Similar to Immigrants from Eastern Africa by Single Mother Households

In terms of single mother households, the demographic groups most similar to Immigrants from Eastern Africa are Immigrants (6.8%, a difference of 0.090%), Aleut (6.8%, a difference of 0.21%), Immigrants from Thailand (6.9%, a difference of 0.27%), Cherokee (6.8%, a difference of 0.36%), and French American Indian (6.9%, a difference of 0.47%).
DemographicsRating | RankSingle Mother Households
Immigrants | Venezuela
8.5
/100
|
#211
Tragic
6.7%
Immigrants | Eritrea
8.4
/100
|
#212
Tragic
6.7%
Immigrants | Costa Rica
8.2
/100
|
#213
Tragic
6.7%
Immigrants | Uruguay
7.9
/100
|
#214
Tragic
6.7%
Shoshone
5.7
/100
|
#215
Tragic
6.8%
Cherokee
5.1
/100
|
#216
Tragic
6.8%
Aleuts
4.8
/100
|
#217
Tragic
6.8%
Immigrants | Eastern Africa
4.4
/100
|
#218
Tragic
6.8%
Immigrants | Immigrants
4.3
/100
|
#219
Tragic
6.8%
Immigrants | Thailand
4.0
/100
|
#220
Tragic
6.9%
French American Indians
3.7
/100
|
#221
Tragic
6.9%
Immigrants | Bangladesh
3.7
/100
|
#222
Tragic
6.9%
Immigrants | Micronesia
3.6
/100
|
#223
Tragic
6.9%
Immigrants | Sudan
3.5
/100
|
#224
Tragic
6.9%
Sudanese
3.1
/100
|
#225
Tragic
6.9%