Nepalese vs Immigrants from Cambodia Family Households

COMPARE

Nepalese
Race
Ancestry
AfghanAfricanAlaska NativeAlaskan AthabascanAlbanianAleutAlsatianAmericanApacheArabArapahoArgentineanArmenianAssyrian/Chaldean/SyriacAustralianAustrianBahamianBangladeshiBarbadianBasqueBelgianBelizeanBermudanBhutaneseBlackfeetBolivianBrazilianBritishBritish West IndianBulgarianBurmeseCajunCambodianCanadianCape VerdeanCarpatho RusynCelticCentral AmericanCentral American IndianCherokeeCheyenneChickasawChileanChineseChippewaChoctawColombianColvilleComancheCosta RicanCreeCreekCroatianCrowCubanCypriotCzechCzechoslovakianDanishDelawareDominicanDutchDutch West IndianEastern EuropeanEcuadorianEgyptianEnglishEstonianEthiopianEuropeanFijianFilipinoFinnishFrenchFrench American IndianFrench CanadianGermanGerman RussianGhanaianGreekGuamanian/ChamorroGuatemalanGuyaneseHaitianHmongHonduranHopiHoumaHungarianIcelanderIndian (Asian)IndonesianInupiatIranianIraqiIrishIroquoisIsraeliItalianJamaicanJapaneseJordanianKenyanKiowaKoreanLaotianLatvianLebaneseLiberianLithuanianLumbeeLuxembourgerMacedonianMalaysianMalteseMarshalleseMenomineeMexicanMexican American IndianMongolianMoroccanNative HawaiianNavajoNepaleseNew ZealanderNicaraguanNigerianNorthern EuropeanNorwegianOkinawanOsageOttawaPaiutePakistaniPalestinianPanamanianParaguayanPennsylvania GermanPeruvianPimaPolishPortuguesePotawatomiPuebloPuerto RicanPuget Sound SalishRomanianRussianSalvadoranSamoanScandinavianScotch-IrishScottishSeminoleSenegaleseSerbianShoshoneSierra LeoneanSiouxSlavicSlovakSloveneSomaliSouth AfricanSouth AmericanSouth American IndianSoviet UnionSpaniardSpanishSpanish AmericanSpanish American IndianSri LankanSubsaharan AfricanSudaneseSwedishSwissSyrianTaiwaneseThaiTlingit-HaidaTohono O'OdhamTonganTrinidadian and TobagonianTsimshianTurkishU.S. Virgin IslanderUgandanUkrainianUruguayanUteVenezuelanVietnameseWelshWest IndianYakamaYaquiYugoslavianYumanYup'ikZimbabwean
Immigration
NonimmigrantsImmigrantsAfghanistanAfricaAlbaniaArgentinaArmeniaAsiaAustraliaAustriaBahamasBangladeshBarbadosBelarusBelgiumBelizeBoliviaBosnia and HerzegovinaBrazilBulgariaBurma/MyanmarCabo VerdeCameroonCanadaCaribbeanCentral AmericaChileChinaColombiaCongoCosta RicaCroatiaCubaCzechoslovakiaDenmarkDominicaDominican RepublicEastern AfricaEastern AsiaEastern EuropeEcuadorEgyptEl SalvadorEnglandEritreaEthiopiaEuropeFijiFranceGermanyGhanaGreeceGrenadaGuatemalaGuyanaHaitiHondurasHong KongHungaryIndiaIndonesiaIranIraqIrelandIsraelItalyJamaicaJapanJordanKazakhstanKenyaKoreaKuwaitLaosLatin AmericaLatviaLebanonLiberiaLithuaniaMalaysiaMexicoMicronesiaMiddle AfricaMoldovaMoroccoNepalNetherlandsNicaraguaNigeriaNorth AmericaNorth MacedoniaNorthern AfricaNorthern EuropeNorwayOceaniaPakistanPanamaPeruPhilippinesPolandPortugalRomaniaRussiaSaudi ArabiaScotlandSenegalSerbiaSierra LeoneSingaporeSomaliaSouth AfricaSouth AmericaSouth Central AsiaSouth Eastern AsiaSouthern EuropeSpainSri LankaSt. Vincent and the GrenadinesSudanSwedenSwitzerlandSyriaTaiwanThailandTrinidad and TobagoTurkeyUgandaUkraineUruguayUzbekistanVenezuelaVietnamWest IndiesWestern AfricaWestern AsiaWestern EuropeYemenZaireZimbabweAzores
Immigrants from Cambodia
Race
Ancestry
AfghanAfricanAlaska NativeAlaskan AthabascanAlbanianAleutAlsatianAmericanApacheArabArapahoArgentineanArmenianAssyrian/Chaldean/SyriacAustralianAustrianBahamianBangladeshiBarbadianBasqueBelgianBelizeanBermudanBhutaneseBlackfeetBolivianBrazilianBritishBritish West IndianBulgarianBurmeseCajunCambodianCanadianCape VerdeanCarpatho RusynCelticCentral AmericanCentral American IndianCherokeeCheyenneChickasawChileanChineseChippewaChoctawColombianColvilleComancheCosta RicanCreeCreekCroatianCrowCubanCypriotCzechCzechoslovakianDanishDelawareDominicanDutchDutch West IndianEastern EuropeanEcuadorianEgyptianEnglishEstonianEthiopianEuropeanFijianFilipinoFinnishFrenchFrench American IndianFrench CanadianGermanGerman RussianGhanaianGreekGuamanian/ChamorroGuatemalanGuyaneseHaitianHmongHonduranHopiHoumaHungarianIcelanderIndian (Asian)IndonesianInupiatIranianIraqiIrishIroquoisIsraeliItalianJamaicanJapaneseJordanianKenyanKiowaKoreanLaotianLatvianLebaneseLiberianLithuanianLumbeeLuxembourgerMacedonianMalaysianMalteseMarshalleseMenomineeMexicanMexican American IndianMongolianMoroccanNative HawaiianNavajoNew ZealanderNicaraguanNigerianNorthern EuropeanNorwegianOkinawanOsageOttawaPaiutePakistaniPalestinianPanamanianParaguayanPennsylvania GermanPeruvianPimaPolishPortuguesePotawatomiPuebloPuerto RicanPuget Sound SalishRomanianRussianSalvadoranSamoanScandinavianScotch-IrishScottishSeminoleSenegaleseSerbianShoshoneSierra LeoneanSiouxSlavicSlovakSloveneSomaliSouth AfricanSouth AmericanSouth American IndianSoviet UnionSpaniardSpanishSpanish AmericanSpanish American IndianSri LankanSubsaharan AfricanSudaneseSwedishSwissSyrianTaiwaneseThaiTlingit-HaidaTohono O'OdhamTonganTrinidadian and TobagonianTsimshianTurkishU.S. Virgin IslanderUgandanUkrainianUruguayanUteVenezuelanVietnameseWelshWest IndianYakamaYaquiYugoslavianYumanYup'ikZimbabwean
Immigration
NonimmigrantsImmigrantsAfghanistanAfricaAlbaniaArgentinaArmeniaAsiaAustraliaAustriaBahamasBangladeshBarbadosBelarusBelgiumBelizeBoliviaBosnia and HerzegovinaBrazilBulgariaBurma/MyanmarCabo VerdeCambodiaCameroonCanadaCaribbeanCentral AmericaChileChinaColombiaCongoCosta RicaCroatiaCubaCzechoslovakiaDenmarkDominicaDominican RepublicEastern AfricaEastern AsiaEastern EuropeEcuadorEgyptEl SalvadorEnglandEritreaEthiopiaEuropeFijiFranceGermanyGhanaGreeceGrenadaGuatemalaGuyanaHaitiHondurasHong KongHungaryIndiaIndonesiaIranIraqIrelandIsraelItalyJamaicaJapanJordanKazakhstanKenyaKoreaKuwaitLaosLatin AmericaLatviaLebanonLiberiaLithuaniaMalaysiaMexicoMicronesiaMiddle AfricaMoldovaMoroccoNepalNetherlandsNicaraguaNigeriaNorth AmericaNorth MacedoniaNorthern AfricaNorthern EuropeNorwayOceaniaPakistanPanamaPeruPhilippinesPolandPortugalRomaniaRussiaSaudi ArabiaScotlandSenegalSerbiaSierra LeoneSingaporeSomaliaSouth AfricaSouth AmericaSouth Central AsiaSouth Eastern AsiaSouthern EuropeSpainSri LankaSt. Vincent and the GrenadinesSudanSwedenSwitzerlandSyriaTaiwanThailandTrinidad and TobagoTurkeyUgandaUkraineUruguayUzbekistanVenezuelaVietnamWest IndiesWestern AfricaWestern AsiaWestern EuropeYemenZaireZimbabweAzores
Family Households
Income
Poverty
Unemployment
Labor Participation
Family Structure
Vehicle Availability
Education Level
Disability

Family Households Comparison

Nepalese

Immigrants from Cambodia

Exceptional
Exceptional
67.2%
FAMILY HOUSEHOLDS
100.0/ 100
METRIC RATING
32nd/ 347
METRIC RANK
65.4%
FAMILY HOUSEHOLDS
99.5/ 100
METRIC RATING
85th/ 347
METRIC RANK

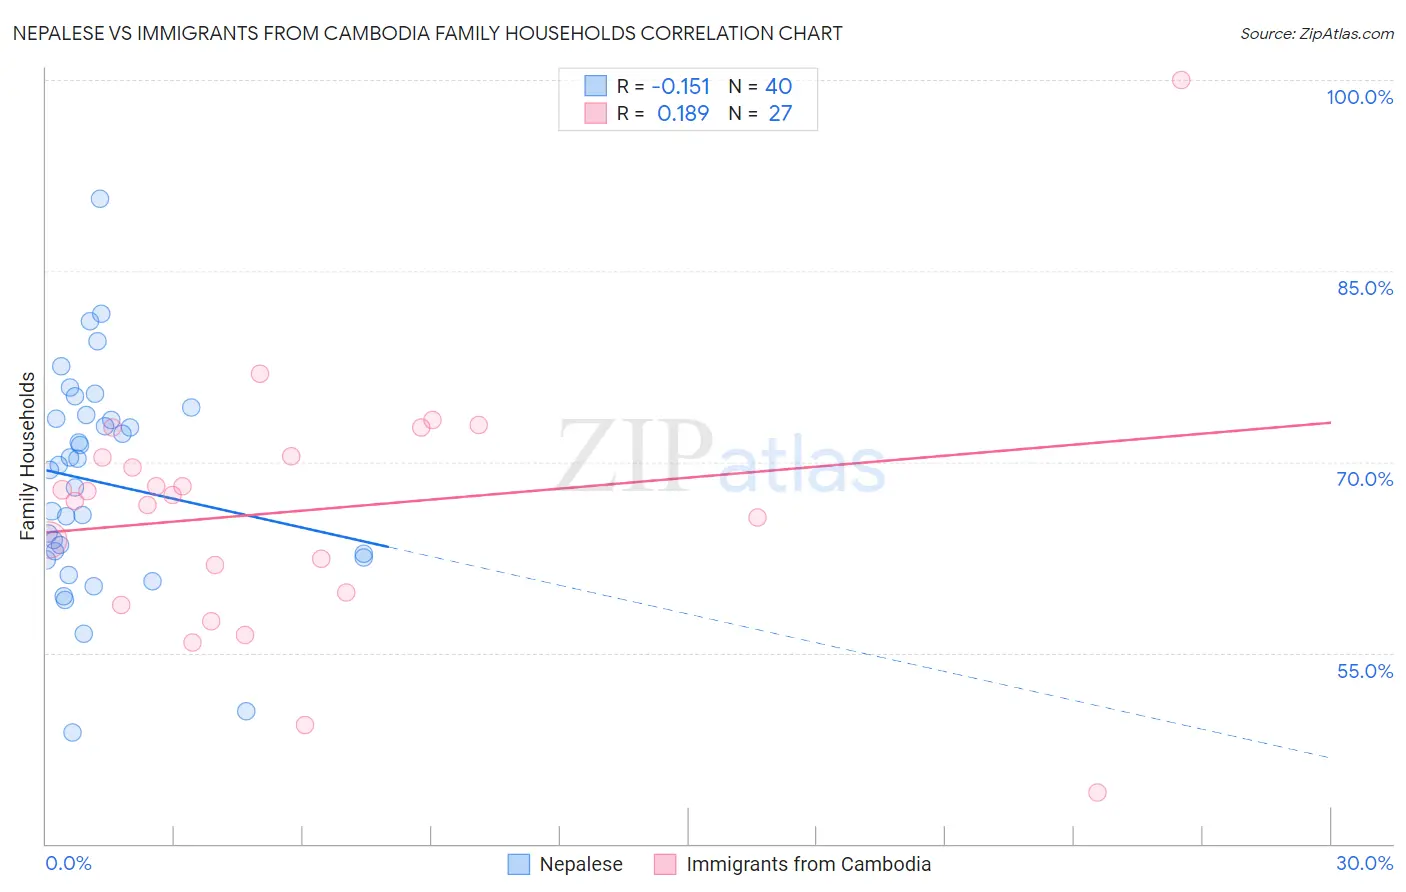
Nepalese vs Immigrants from Cambodia Family Households Correlation Chart

The statistical analysis conducted on geographies consisting of 24,521,755 people shows a poor negative correlation between the proportion of Nepalese and percentage of family households in the United States with a correlation coefficient (R) of -0.151 and weighted average of 67.2%. Similarly, the statistical analysis conducted on geographies consisting of 205,129,465 people shows a poor positive correlation between the proportion of Immigrants from Cambodia and percentage of family households in the United States with a correlation coefficient (R) of 0.189 and weighted average of 65.4%, a difference of 2.7%.
Nepalese vs Immigrants from Cambodia Family Households

Family Households Correlation Summary

MeasurementNepaleseImmigrants from Cambodia
Minimum48.7%44.0%
Maximum90.6%100.0%
Range41.9%56.0%
Mean68.4%66.2%
Median69.5%67.4%
Interquartile 25% (IQ1)62.7%59.7%
Interquartile 75% (IQ3)73.5%70.5%
Interquartile Range (IQR)10.9%10.7%
Standard Deviation (Sample)8.5%10.2%
Standard Deviation (Population)8.4%10.0%

Similar Demographics by Family Households

Demographics Similar to Nepalese by Family Households

In terms of family households, the demographic groups most similar to Nepalese are Salvadoran (67.2%, a difference of 0.040%), Thai (67.2%, a difference of 0.040%), Immigrants from Latin America (67.2%, a difference of 0.060%), Immigrants from Peru (67.2%, a difference of 0.070%), and Tohono O'odham (67.1%, a difference of 0.090%).
DemographicsRating | RankFamily Households
Immigrants | Nicaragua
100.0
/100
|
#25
Exceptional
67.5%
Immigrants | India
100.0
/100
|
#26
Exceptional
67.4%
Hispanics or Latinos
100.0
/100
|
#27
Exceptional
67.4%
Hawaiians
100.0
/100
|
#28
Exceptional
67.4%
Nicaraguans
100.0
/100
|
#29
Exceptional
67.4%
Immigrants | Peru
100.0
/100
|
#30
Exceptional
67.2%
Immigrants | Latin America
100.0
/100
|
#31
Exceptional
67.2%
Nepalese
100.0
/100
|
#32
Exceptional
67.2%
Salvadorans
100.0
/100
|
#33
Exceptional
67.2%
Thais
100.0
/100
|
#34
Exceptional
67.2%
Tohono O'odham
100.0
/100
|
#35
Exceptional
67.1%
Peruvians
100.0
/100
|
#36
Exceptional
67.1%
Tsimshian
100.0
/100
|
#37
Exceptional
67.1%
Mexican American Indians
100.0
/100
|
#38
Exceptional
67.0%
Immigrants | El Salvador
100.0
/100
|
#39
Exceptional
67.0%

Demographics Similar to Immigrants from Cambodia by Family Households

In terms of family households, the demographic groups most similar to Immigrants from Cambodia are Egyptian (65.4%, a difference of 0.050%), American (65.5%, a difference of 0.11%), Immigrants from Lebanon (65.5%, a difference of 0.13%), Immigrants from Guyana (65.5%, a difference of 0.13%), and Immigrants from Egypt (65.3%, a difference of 0.14%).
DemographicsRating | RankFamily Households
Yaqui
99.8
/100
|
#78
Exceptional
65.6%
Immigrants | Costa Rica
99.8
/100
|
#79
Exceptional
65.6%
Puget Sound Salish
99.8
/100
|
#80
Exceptional
65.6%
Jordanians
99.7
/100
|
#81
Exceptional
65.5%
Immigrants | Lebanon
99.7
/100
|
#82
Exceptional
65.5%
Immigrants | Guyana
99.6
/100
|
#83
Exceptional
65.5%
Americans
99.6
/100
|
#84
Exceptional
65.5%
Immigrants | Cambodia
99.5
/100
|
#85
Exceptional
65.4%
Egyptians
99.4
/100
|
#86
Exceptional
65.4%
Immigrants | Egypt
99.2
/100
|
#87
Exceptional
65.3%
Immigrants | Haiti
99.1
/100
|
#88
Exceptional
65.3%
Immigrants | Caribbean
99.1
/100
|
#89
Exceptional
65.3%
Immigrants | Laos
99.1
/100
|
#90
Exceptional
65.3%
Crow
98.9
/100
|
#91
Exceptional
65.3%
Hopi
98.8
/100
|
#92
Exceptional
65.3%