Mexican vs Immigrants Births to Unmarried Women
COMPARE
Mexican
Immigrants
Births to Unmarried Women
Births to Unmarried Women Comparison
Mexicans
Immigrants
36.9%
BIRTHS TO UNMARRIED WOMEN
0.1/ 100
METRIC RATING
273rd/ 347
METRIC RANK
32.7%
BIRTHS TO UNMARRIED WOMEN
20.6/ 100
METRIC RATING
197th/ 347
METRIC RANK
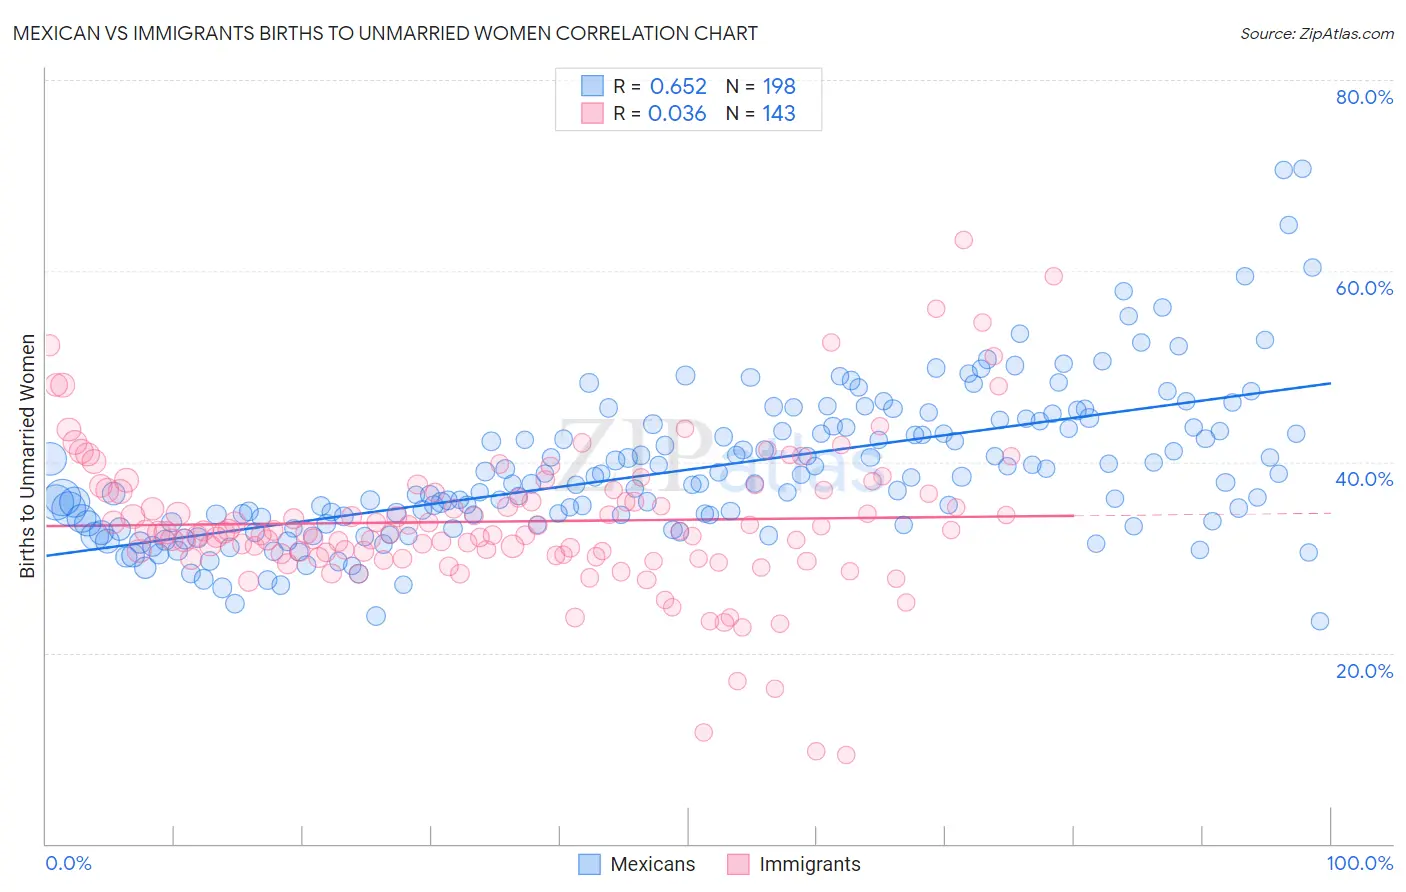
Mexican vs Immigrants Births to Unmarried Women Correlation Chart
The statistical analysis conducted on geographies consisting of 505,082,784 people shows a significant positive correlation between the proportion of Mexicans and percentage of births to unmarried women in the United States with a correlation coefficient (R) of 0.652 and weighted average of 36.9%. Similarly, the statistical analysis conducted on geographies consisting of 510,959,852 people shows no correlation between the proportion of Immigrants and percentage of births to unmarried women in the United States with a correlation coefficient (R) of 0.036 and weighted average of 32.7%, a difference of 13.0%.
Births to Unmarried Women Correlation Summary
| Measurement | Mexican | Immigrants |
| Minimum | 23.3% | 9.4% |
| Maximum | 70.7% | 63.3% |
| Range | 47.4% | 53.9% |
| Mean | 39.1% | 33.8% |
| Median | 37.7% | 32.6% |
| Interquartile 25% (IQ1) | 33.5% | 30.2% |
| Interquartile 75% (IQ3) | 43.6% | 37.0% |
| Interquartile Range (IQR) | 10.1% | 6.8% |
| Standard Deviation (Sample) | 8.0% | 8.0% |
| Standard Deviation (Population) | 7.9% | 8.0% |
Similar Demographics by Births to Unmarried Women
Demographics Similar to Mexicans by Births to Unmarried Women
In terms of births to unmarried women, the demographic groups most similar to Mexicans are Cree (37.0%, a difference of 0.090%), Choctaw (36.9%, a difference of 0.12%), Barbadian (37.0%, a difference of 0.12%), Belizean (37.0%, a difference of 0.31%), and Immigrants from Barbados (36.8%, a difference of 0.33%).
| Demographics | Rating | Rank | Births to Unmarried Women |
| Immigrants | Senegal | 0.1 /100 | #266 | Tragic 36.7% |
| Central Americans | 0.1 /100 | #267 | Tragic 36.7% |
| Comanche | 0.1 /100 | #268 | Tragic 36.7% |
| Senegalese | 0.1 /100 | #269 | Tragic 36.8% |
| Immigrants | Congo | 0.1 /100 | #270 | Tragic 36.8% |
| Immigrants | Barbados | 0.1 /100 | #271 | Tragic 36.8% |
| Choctaw | 0.1 /100 | #272 | Tragic 36.9% |
| Mexicans | 0.1 /100 | #273 | Tragic 36.9% |
| Cree | 0.1 /100 | #274 | Tragic 37.0% |
| Barbadians | 0.1 /100 | #275 | Tragic 37.0% |
| Belizeans | 0.1 /100 | #276 | Tragic 37.0% |
| Guatemalans | 0.1 /100 | #277 | Tragic 37.1% |
| Immigrants | Latin America | 0.1 /100 | #278 | Tragic 37.1% |
| West Indians | 0.1 /100 | #279 | Tragic 37.3% |
| Immigrants | St. Vincent and the Grenadines | 0.1 /100 | #280 | Tragic 37.3% |
Demographics Similar to Immigrants by Births to Unmarried Women
In terms of births to unmarried women, the demographic groups most similar to Immigrants are Costa Rican (32.7%, a difference of 0.050%), Immigrants from Colombia (32.6%, a difference of 0.15%), Samoan (32.6%, a difference of 0.18%), Immigrants from Thailand (32.8%, a difference of 0.25%), and Immigrants from Germany (32.8%, a difference of 0.26%).
| Demographics | Rating | Rank | Births to Unmarried Women |
| Tlingit-Haida | 32.6 /100 | #190 | Fair 32.2% |
| Irish | 32.4 /100 | #191 | Fair 32.2% |
| Colombians | 31.9 /100 | #192 | Fair 32.2% |
| Fijians | 31.1 /100 | #193 | Fair 32.3% |
| Sudanese | 27.3 /100 | #194 | Fair 32.4% |
| Samoans | 21.9 /100 | #195 | Fair 32.6% |
| Immigrants | Colombia | 21.7 /100 | #196 | Fair 32.6% |
| Immigrants | Immigrants | 20.6 /100 | #197 | Fair 32.7% |
| Costa Ricans | 20.3 /100 | #198 | Fair 32.7% |
| Immigrants | Thailand | 18.9 /100 | #199 | Poor 32.8% |
| Immigrants | Germany | 18.8 /100 | #200 | Poor 32.8% |
| Immigrants | Burma/Myanmar | 16.7 /100 | #201 | Poor 32.9% |
| Immigrants | Micronesia | 16.6 /100 | #202 | Poor 32.9% |
| Ute | 14.4 /100 | #203 | Poor 33.0% |
| Immigrants | Africa | 14.3 /100 | #204 | Poor 33.0% |