Mexican American Indian vs Navajo Family Households
COMPARE
Mexican American Indian
Navajo
Family Households
Family Households Comparison
Mexican American Indians
Navajo
67.0%
FAMILY HOUSEHOLDS
100.0/ 100
METRIC RATING
38th/ 347
METRIC RANK
66.4%
FAMILY HOUSEHOLDS
100.0/ 100
METRIC RATING
50th/ 347
METRIC RANK
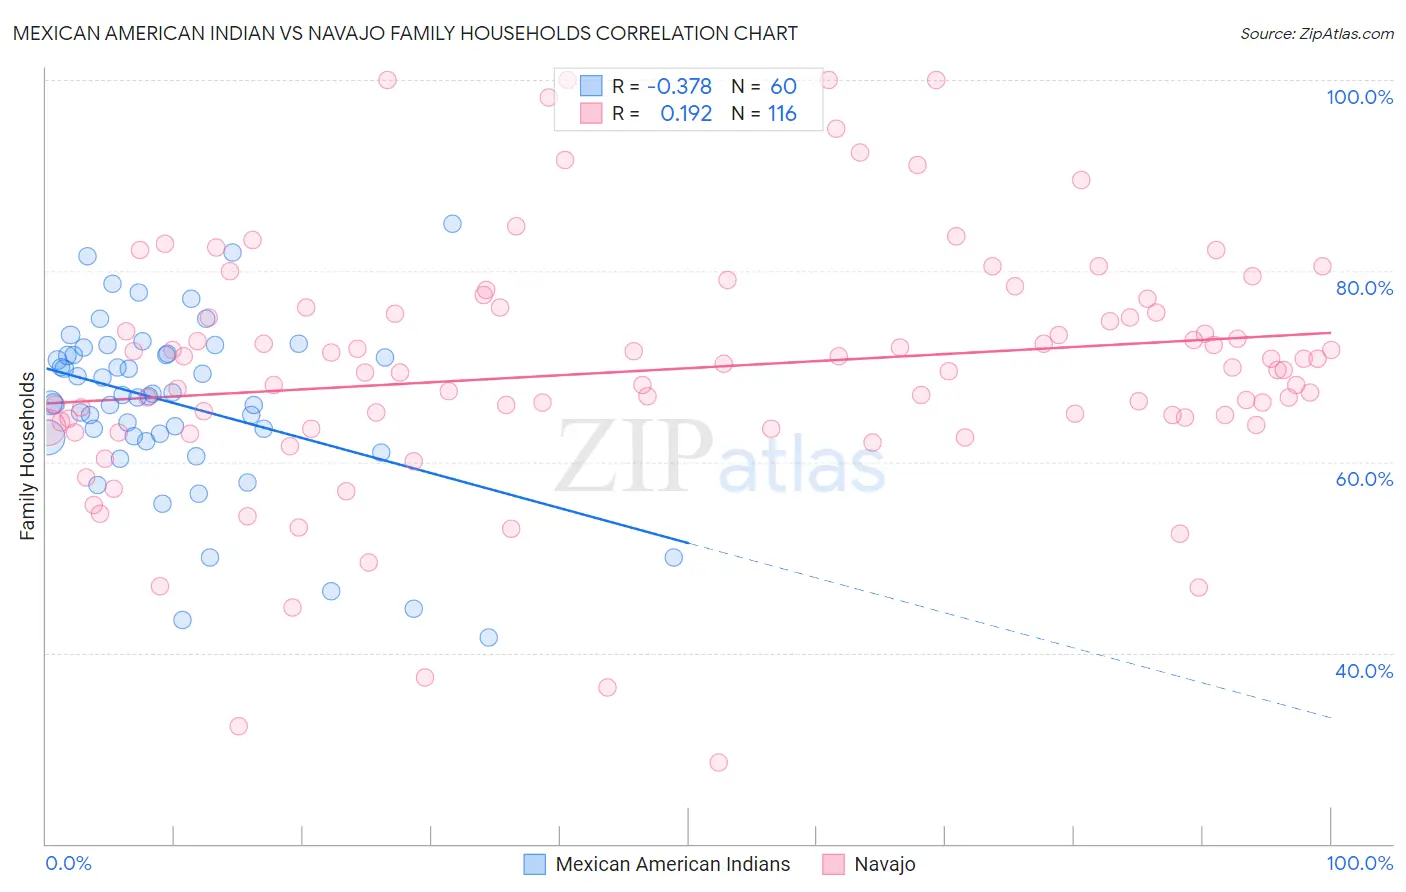
Mexican American Indian vs Navajo Family Households Correlation Chart
The statistical analysis conducted on geographies consisting of 317,495,580 people shows a mild negative correlation between the proportion of Mexican American Indians and percentage of family households in the United States with a correlation coefficient (R) of -0.378 and weighted average of 67.0%. Similarly, the statistical analysis conducted on geographies consisting of 224,752,458 people shows a poor positive correlation between the proportion of Navajo and percentage of family households in the United States with a correlation coefficient (R) of 0.192 and weighted average of 66.4%, a difference of 0.96%.
Family Households Correlation Summary
| Measurement | Mexican American Indian | Navajo |
| Minimum | 41.6% | 28.6% |
| Maximum | 85.0% | 100.0% |
| Range | 43.4% | 71.4% |
| Mean | 66.1% | 69.7% |
| Median | 67.0% | 69.7% |
| Interquartile 25% (IQ1) | 62.6% | 64.0% |
| Interquartile 75% (IQ3) | 71.3% | 75.9% |
| Interquartile Range (IQR) | 8.6% | 11.9% |
| Standard Deviation (Sample) | 9.1% | 13.1% |
| Standard Deviation (Population) | 9.0% | 13.0% |
Demographics Similar to Mexican American Indians and Navajo by Family Households
In terms of family households, the demographic groups most similar to Mexican American Indians are Immigrants from El Salvador (67.0%, a difference of 0.020%), Tsimshian (67.1%, a difference of 0.10%), Peruvian (67.1%, a difference of 0.17%), Tohono O'odham (67.1%, a difference of 0.18%), and Thai (67.2%, a difference of 0.23%). Similarly, the demographic groups most similar to Navajo are Native/Alaskan (66.4%, a difference of 0.030%), Immigrants from South Central Asia (66.4%, a difference of 0.070%), Immigrants from Venezuela (66.4%, a difference of 0.12%), Bolivian (66.5%, a difference of 0.14%), and Colombian (66.3%, a difference of 0.16%).
| Demographics | Rating | Rank | Family Households |
| Thais | 100.0 /100 | #34 | Exceptional 67.2% |
| Tohono O'odham | 100.0 /100 | #35 | Exceptional 67.1% |
| Peruvians | 100.0 /100 | #36 | Exceptional 67.1% |
| Tsimshian | 100.0 /100 | #37 | Exceptional 67.1% |
| Mexican American Indians | 100.0 /100 | #38 | Exceptional 67.0% |
| Immigrants | El Salvador | 100.0 /100 | #39 | Exceptional 67.0% |
| Guamanians/Chamorros | 100.0 /100 | #40 | Exceptional 66.6% |
| Immigrants | Bolivia | 100.0 /100 | #41 | Exceptional 66.6% |
| Menominee | 100.0 /100 | #42 | Exceptional 66.5% |
| Apache | 100.0 /100 | #43 | Exceptional 66.5% |
| Asians | 100.0 /100 | #44 | Exceptional 66.5% |
| Venezuelans | 100.0 /100 | #45 | Exceptional 66.5% |
| Arapaho | 100.0 /100 | #46 | Exceptional 66.5% |
| Bolivians | 100.0 /100 | #47 | Exceptional 66.5% |
| Immigrants | Venezuela | 100.0 /100 | #48 | Exceptional 66.4% |
| Immigrants | South Central Asia | 100.0 /100 | #49 | Exceptional 66.4% |
| Navajo | 100.0 /100 | #50 | Exceptional 66.4% |
| Natives/Alaskans | 100.0 /100 | #51 | Exceptional 66.4% |
| Colombians | 100.0 /100 | #52 | Exceptional 66.3% |
| Afghans | 100.0 /100 | #53 | Exceptional 66.3% |
| Immigrants | Colombia | 100.0 /100 | #54 | Exceptional 66.3% |