Immigrants from Peru vs Navajo Family Households
COMPARE
Immigrants from Peru
Navajo
Family Households
Family Households Comparison
Immigrants from Peru
Navajo
67.2%
FAMILY HOUSEHOLDS
100.0/ 100
METRIC RATING
30th/ 347
METRIC RANK
66.4%
FAMILY HOUSEHOLDS
100.0/ 100
METRIC RATING
50th/ 347
METRIC RANK
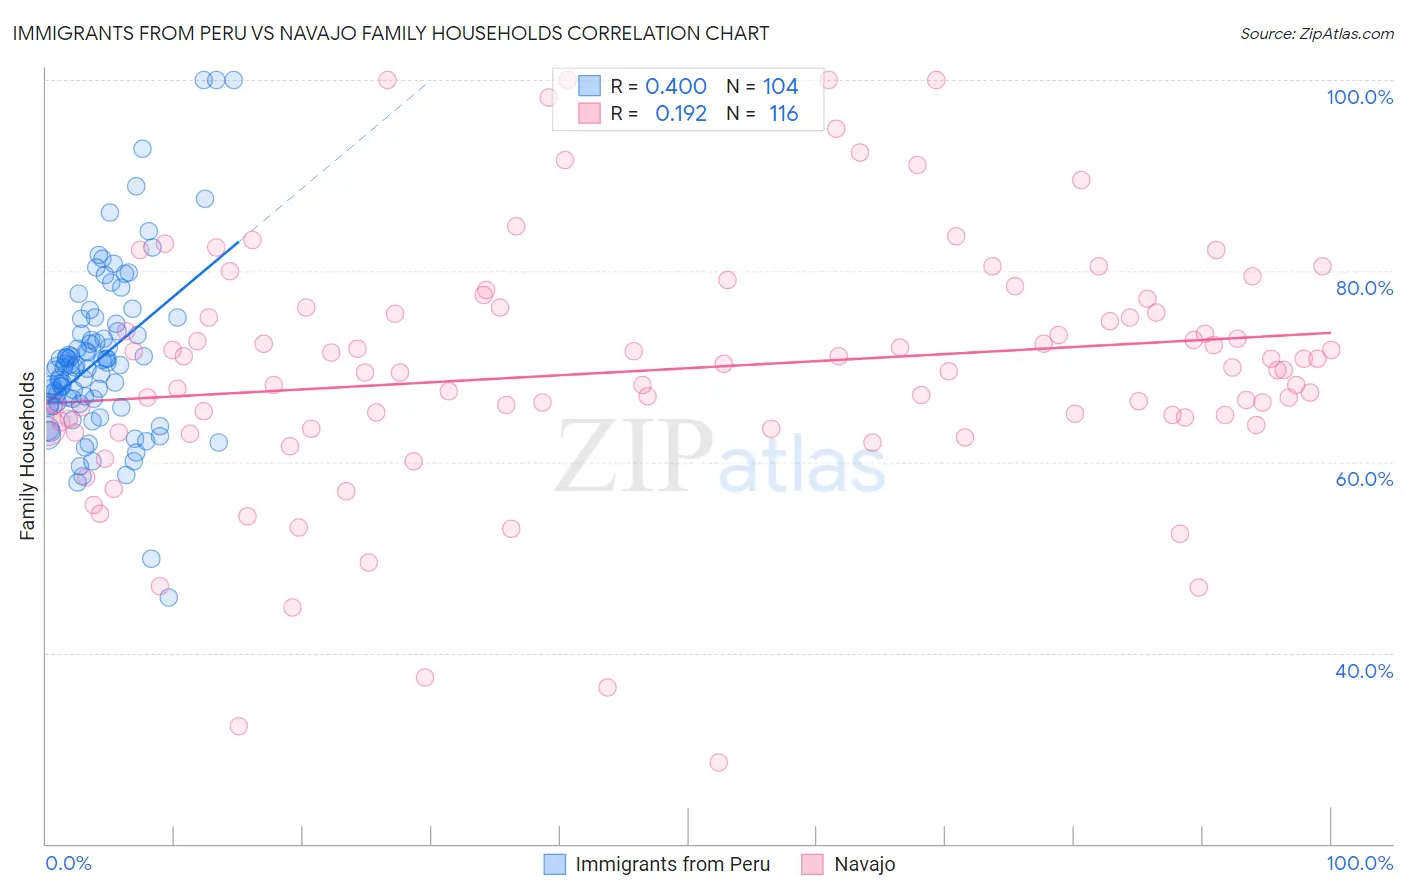
Immigrants from Peru vs Navajo Family Households Correlation Chart
The statistical analysis conducted on geographies consisting of 328,761,314 people shows a mild positive correlation between the proportion of Immigrants from Peru and percentage of family households in the United States with a correlation coefficient (R) of 0.400 and weighted average of 67.2%. Similarly, the statistical analysis conducted on geographies consisting of 224,752,458 people shows a poor positive correlation between the proportion of Navajo and percentage of family households in the United States with a correlation coefficient (R) of 0.192 and weighted average of 66.4%, a difference of 1.3%.
Family Households Correlation Summary
| Measurement | Immigrants from Peru | Navajo |
| Minimum | 45.8% | 28.6% |
| Maximum | 100.0% | 100.0% |
| Range | 54.2% | 71.4% |
| Mean | 70.8% | 69.7% |
| Median | 69.9% | 69.7% |
| Interquartile 25% (IQ1) | 66.1% | 64.0% |
| Interquartile 75% (IQ3) | 73.6% | 75.9% |
| Interquartile Range (IQR) | 7.5% | 11.9% |
| Standard Deviation (Sample) | 9.0% | 13.1% |
| Standard Deviation (Population) | 8.9% | 13.0% |
Demographics Similar to Immigrants from Peru and Navajo by Family Households
In terms of family households, the demographic groups most similar to Immigrants from Peru are Immigrants from Latin America (67.2%, a difference of 0.010%), Nepalese (67.2%, a difference of 0.070%), Salvadoran (67.2%, a difference of 0.11%), Thai (67.2%, a difference of 0.12%), and Tohono O'odham (67.1%, a difference of 0.17%). Similarly, the demographic groups most similar to Navajo are Immigrants from South Central Asia (66.4%, a difference of 0.070%), Immigrants from Venezuela (66.4%, a difference of 0.12%), Bolivian (66.5%, a difference of 0.14%), Arapaho (66.5%, a difference of 0.17%), and Venezuelan (66.5%, a difference of 0.19%).
| Demographics | Rating | Rank | Family Households |
| Immigrants | Peru | 100.0 /100 | #30 | Exceptional 67.2% |
| Immigrants | Latin America | 100.0 /100 | #31 | Exceptional 67.2% |
| Nepalese | 100.0 /100 | #32 | Exceptional 67.2% |
| Salvadorans | 100.0 /100 | #33 | Exceptional 67.2% |
| Thais | 100.0 /100 | #34 | Exceptional 67.2% |
| Tohono O'odham | 100.0 /100 | #35 | Exceptional 67.1% |
| Peruvians | 100.0 /100 | #36 | Exceptional 67.1% |
| Tsimshian | 100.0 /100 | #37 | Exceptional 67.1% |
| Mexican American Indians | 100.0 /100 | #38 | Exceptional 67.0% |
| Immigrants | El Salvador | 100.0 /100 | #39 | Exceptional 67.0% |
| Guamanians/Chamorros | 100.0 /100 | #40 | Exceptional 66.6% |
| Immigrants | Bolivia | 100.0 /100 | #41 | Exceptional 66.6% |
| Menominee | 100.0 /100 | #42 | Exceptional 66.5% |
| Apache | 100.0 /100 | #43 | Exceptional 66.5% |
| Asians | 100.0 /100 | #44 | Exceptional 66.5% |
| Venezuelans | 100.0 /100 | #45 | Exceptional 66.5% |
| Arapaho | 100.0 /100 | #46 | Exceptional 66.5% |
| Bolivians | 100.0 /100 | #47 | Exceptional 66.5% |
| Immigrants | Venezuela | 100.0 /100 | #48 | Exceptional 66.4% |
| Immigrants | South Central Asia | 100.0 /100 | #49 | Exceptional 66.4% |
| Navajo | 100.0 /100 | #50 | Exceptional 66.4% |