Marshallese vs Immigrants from Micronesia Family Households
COMPARE
Marshallese
Immigrants from Micronesia
Family Households
Family Households Comparison
Marshallese
Immigrants from Micronesia
63.7%
FAMILY HOUSEHOLDS
6.9/ 100
METRIC RATING
218th/ 347
METRIC RANK
64.2%
FAMILY HOUSEHOLDS
42.3/ 100
METRIC RATING
177th/ 347
METRIC RANK
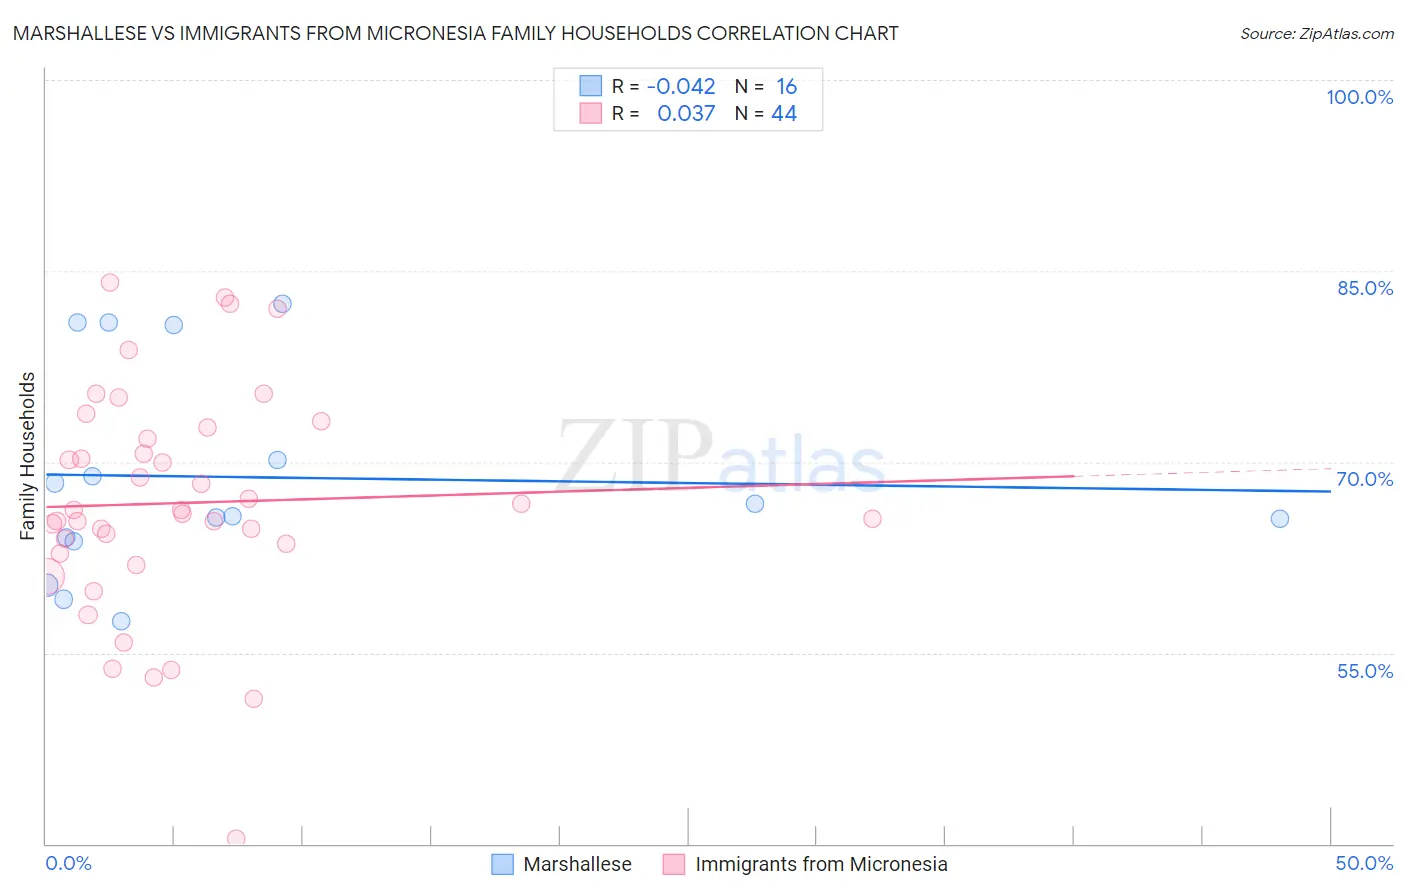
Marshallese vs Immigrants from Micronesia Family Households Correlation Chart
The statistical analysis conducted on geographies consisting of 14,761,315 people shows no correlation between the proportion of Marshallese and percentage of family households in the United States with a correlation coefficient (R) of -0.042 and weighted average of 63.7%. Similarly, the statistical analysis conducted on geographies consisting of 61,601,070 people shows no correlation between the proportion of Immigrants from Micronesia and percentage of family households in the United States with a correlation coefficient (R) of 0.037 and weighted average of 64.2%, a difference of 0.78%.
Family Households Correlation Summary
| Measurement | Marshallese | Immigrants from Micronesia |
| Minimum | 57.4% | 40.4% |
| Maximum | 82.4% | 84.1% |
| Range | 25.0% | 43.7% |
| Mean | 68.8% | 66.8% |
| Median | 66.2% | 66.1% |
| Interquartile 25% (IQ1) | 63.9% | 63.2% |
| Interquartile 75% (IQ3) | 75.4% | 72.3% |
| Interquartile Range (IQR) | 11.5% | 9.1% |
| Standard Deviation (Sample) | 8.2% | 8.9% |
| Standard Deviation (Population) | 7.9% | 8.8% |
Similar Demographics by Family Households
Demographics Similar to Marshallese by Family Households
In terms of family households, the demographic groups most similar to Marshallese are Osage (63.7%, a difference of 0.0%), Croatian (63.8%, a difference of 0.020%), Belgian (63.8%, a difference of 0.030%), Macedonian (63.7%, a difference of 0.030%), and Immigrants from Europe (63.7%, a difference of 0.030%).
| Demographics | Rating | Rank | Family Households |
| Shoshone | 9.4 /100 | #211 | Tragic 63.8% |
| Immigrants | Netherlands | 9.4 /100 | #212 | Tragic 63.8% |
| Immigrants | Northern Europe | 8.8 /100 | #213 | Tragic 63.8% |
| Celtics | 8.0 /100 | #214 | Tragic 63.8% |
| Belgians | 7.6 /100 | #215 | Tragic 63.8% |
| Croatians | 7.3 /100 | #216 | Tragic 63.8% |
| Osage | 7.0 /100 | #217 | Tragic 63.7% |
| Marshallese | 6.9 /100 | #218 | Tragic 63.7% |
| Macedonians | 6.5 /100 | #219 | Tragic 63.7% |
| Immigrants | Europe | 6.4 /100 | #220 | Tragic 63.7% |
| Immigrants | South Africa | 5.9 /100 | #221 | Tragic 63.7% |
| Immigrants | Belarus | 5.5 /100 | #222 | Tragic 63.7% |
| French Canadians | 5.4 /100 | #223 | Tragic 63.7% |
| Turks | 4.5 /100 | #224 | Tragic 63.6% |
| Immigrants | Hungary | 4.3 /100 | #225 | Tragic 63.6% |
Demographics Similar to Immigrants from Micronesia by Family Households
In terms of family households, the demographic groups most similar to Immigrants from Micronesia are Vietnamese (64.2%, a difference of 0.020%), Jamaican (64.2%, a difference of 0.020%), Bangladeshi (64.3%, a difference of 0.030%), Immigrants from Ukraine (64.2%, a difference of 0.060%), and Immigrants from Germany (64.3%, a difference of 0.10%).
| Demographics | Rating | Rank | Family Households |
| Armenians | 55.9 /100 | #170 | Average 64.4% |
| Ute | 54.6 /100 | #171 | Average 64.3% |
| Dutch West Indians | 53.9 /100 | #172 | Average 64.3% |
| Immigrants | Sierra Leone | 52.5 /100 | #173 | Average 64.3% |
| Immigrants | Germany | 50.0 /100 | #174 | Average 64.3% |
| Bangladeshis | 44.3 /100 | #175 | Average 64.3% |
| Vietnamese | 43.6 /100 | #176 | Average 64.2% |
| Immigrants | Micronesia | 42.3 /100 | #177 | Average 64.2% |
| Jamaicans | 40.6 /100 | #178 | Average 64.2% |
| Immigrants | Ukraine | 38.2 /100 | #179 | Fair 64.2% |
| Immigrants | Honduras | 35.0 /100 | #180 | Fair 64.2% |
| Immigrants | Trinidad and Tobago | 34.9 /100 | #181 | Fair 64.2% |
| Ukrainians | 34.6 /100 | #182 | Fair 64.2% |
| Creek | 34.1 /100 | #183 | Fair 64.2% |
| Puerto Ricans | 33.4 /100 | #184 | Fair 64.2% |