Marshallese vs Houma Family Households
COMPARE
Marshallese
Houma
Family Households
Family Households Comparison
Marshallese
Houma
63.7%
FAMILY HOUSEHOLDS
6.9/ 100
METRIC RATING
218th/ 347
METRIC RANK
65.7%
FAMILY HOUSEHOLDS
99.9/ 100
METRIC RATING
75th/ 347
METRIC RANK
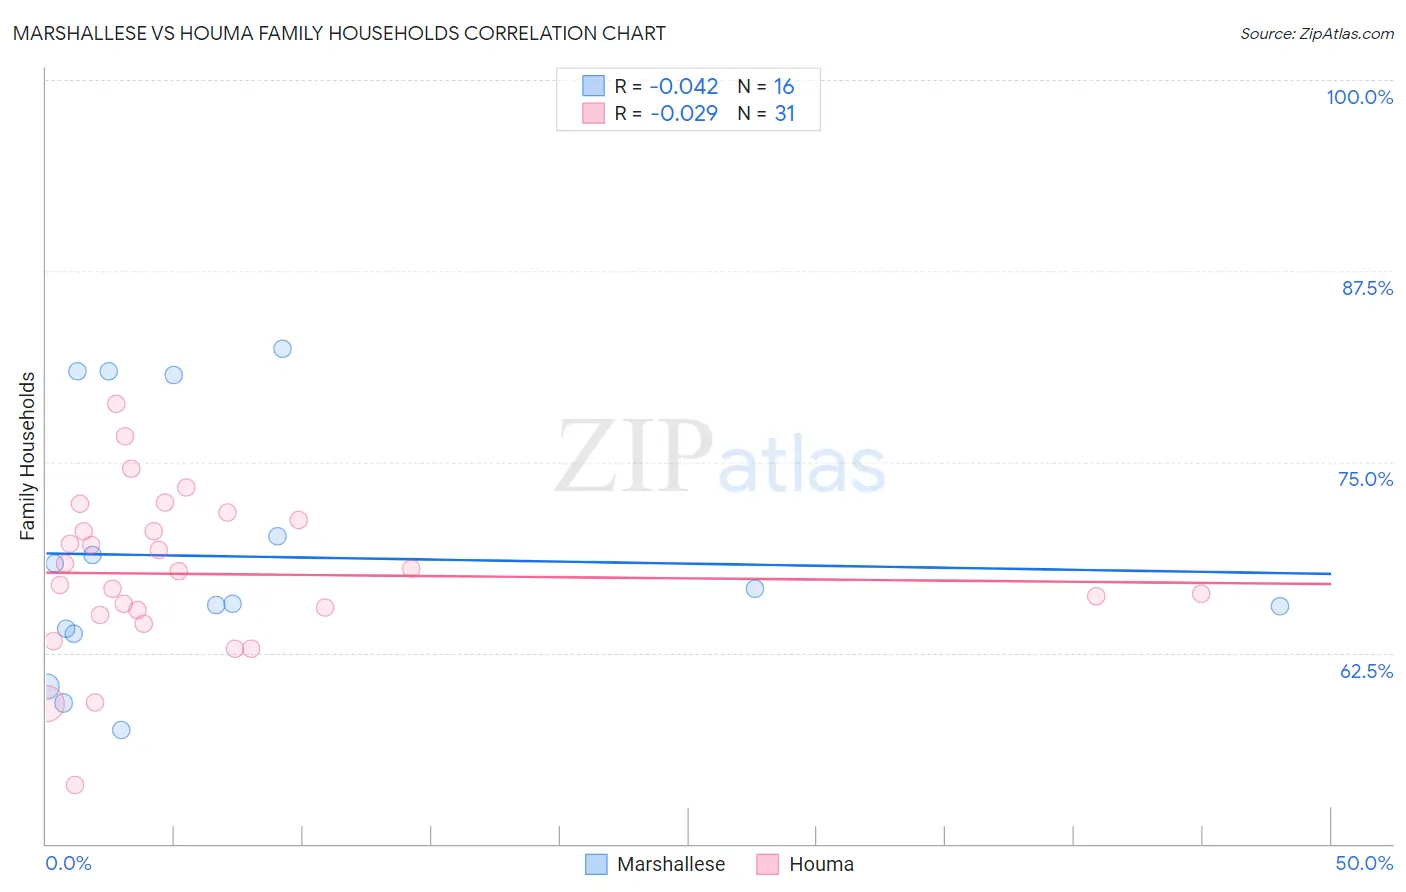
Marshallese vs Houma Family Households Correlation Chart
The statistical analysis conducted on geographies consisting of 14,761,315 people shows no correlation between the proportion of Marshallese and percentage of family households in the United States with a correlation coefficient (R) of -0.042 and weighted average of 63.7%. Similarly, the statistical analysis conducted on geographies consisting of 36,793,599 people shows no correlation between the proportion of Houma and percentage of family households in the United States with a correlation coefficient (R) of -0.029 and weighted average of 65.7%, a difference of 3.1%.
Family Households Correlation Summary
| Measurement | Marshallese | Houma |
| Minimum | 57.4% | 53.8% |
| Maximum | 82.4% | 78.8% |
| Range | 25.0% | 25.0% |
| Mean | 68.8% | 67.7% |
| Median | 66.2% | 67.8% |
| Interquartile 25% (IQ1) | 63.9% | 65.0% |
| Interquartile 75% (IQ3) | 75.4% | 71.2% |
| Interquartile Range (IQR) | 11.5% | 6.3% |
| Standard Deviation (Sample) | 8.2% | 5.2% |
| Standard Deviation (Population) | 7.9% | 5.1% |
Similar Demographics by Family Households
Demographics Similar to Marshallese by Family Households
In terms of family households, the demographic groups most similar to Marshallese are Osage (63.7%, a difference of 0.0%), Croatian (63.8%, a difference of 0.020%), Belgian (63.8%, a difference of 0.030%), Macedonian (63.7%, a difference of 0.030%), and Immigrants from Europe (63.7%, a difference of 0.030%).
| Demographics | Rating | Rank | Family Households |
| Shoshone | 9.4 /100 | #211 | Tragic 63.8% |
| Immigrants | Netherlands | 9.4 /100 | #212 | Tragic 63.8% |
| Immigrants | Northern Europe | 8.8 /100 | #213 | Tragic 63.8% |
| Celtics | 8.0 /100 | #214 | Tragic 63.8% |
| Belgians | 7.6 /100 | #215 | Tragic 63.8% |
| Croatians | 7.3 /100 | #216 | Tragic 63.8% |
| Osage | 7.0 /100 | #217 | Tragic 63.7% |
| Marshallese | 6.9 /100 | #218 | Tragic 63.7% |
| Macedonians | 6.5 /100 | #219 | Tragic 63.7% |
| Immigrants | Europe | 6.4 /100 | #220 | Tragic 63.7% |
| Immigrants | South Africa | 5.9 /100 | #221 | Tragic 63.7% |
| Immigrants | Belarus | 5.5 /100 | #222 | Tragic 63.7% |
| French Canadians | 5.4 /100 | #223 | Tragic 63.7% |
| Turks | 4.5 /100 | #224 | Tragic 63.6% |
| Immigrants | Hungary | 4.3 /100 | #225 | Tragic 63.6% |
Demographics Similar to Houma by Family Households
In terms of family households, the demographic groups most similar to Houma are Burmese (65.7%, a difference of 0.050%), Laotian (65.8%, a difference of 0.090%), Immigrants from the Azores (65.6%, a difference of 0.12%), Immigrants from South America (65.6%, a difference of 0.12%), and Yaqui (65.6%, a difference of 0.12%).
| Demographics | Rating | Rank | Family Households |
| Japanese | 99.9 /100 | #68 | Exceptional 65.9% |
| Malaysians | 99.9 /100 | #69 | Exceptional 65.9% |
| Immigrants | Afghanistan | 99.9 /100 | #70 | Exceptional 65.9% |
| Bhutanese | 99.9 /100 | #71 | Exceptional 65.9% |
| Portuguese | 99.9 /100 | #72 | Exceptional 65.8% |
| Laotians | 99.9 /100 | #73 | Exceptional 65.8% |
| Burmese | 99.9 /100 | #74 | Exceptional 65.7% |
| Houma | 99.9 /100 | #75 | Exceptional 65.7% |
| Immigrants | Azores | 99.8 /100 | #76 | Exceptional 65.6% |
| Immigrants | South America | 99.8 /100 | #77 | Exceptional 65.6% |
| Yaqui | 99.8 /100 | #78 | Exceptional 65.6% |
| Immigrants | Costa Rica | 99.8 /100 | #79 | Exceptional 65.6% |
| Puget Sound Salish | 99.8 /100 | #80 | Exceptional 65.6% |
| Jordanians | 99.7 /100 | #81 | Exceptional 65.5% |
| Immigrants | Lebanon | 99.7 /100 | #82 | Exceptional 65.5% |