Luxembourger vs Sudanese Single Mother Households
COMPARE
Luxembourger
Sudanese
Single Mother Households
Single Mother Households Comparison
Luxembourgers
Sudanese
5.6%
SINGLE MOTHER HOUSEHOLDS
98.7/ 100
METRIC RATING
59th/ 347
METRIC RANK
6.9%
SINGLE MOTHER HOUSEHOLDS
3.1/ 100
METRIC RATING
225th/ 347
METRIC RANK
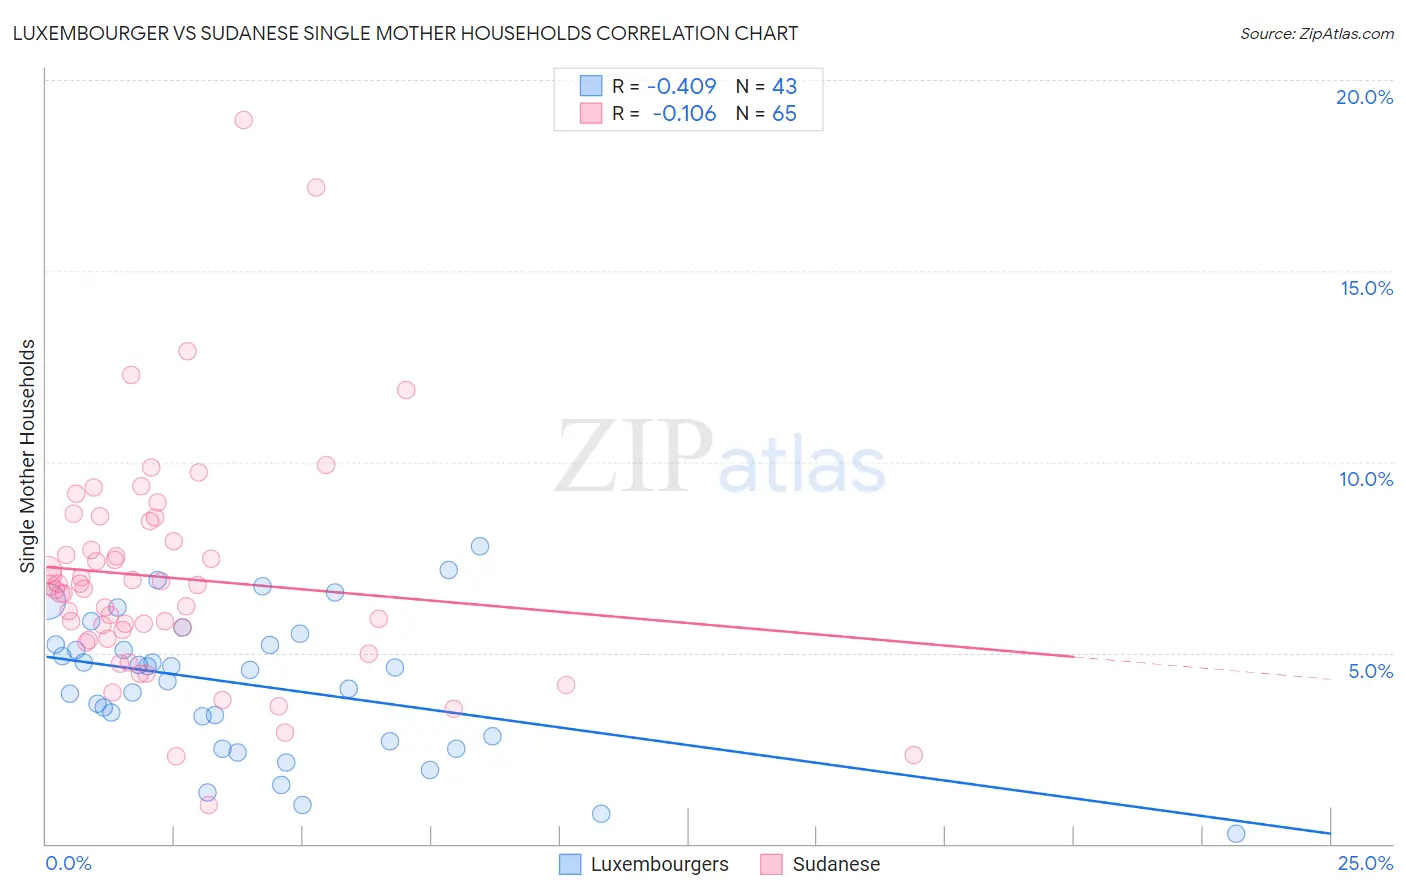
Luxembourger vs Sudanese Single Mother Households Correlation Chart
The statistical analysis conducted on geographies consisting of 144,304,959 people shows a moderate negative correlation between the proportion of Luxembourgers and percentage of single mother households in the United States with a correlation coefficient (R) of -0.409 and weighted average of 5.6%. Similarly, the statistical analysis conducted on geographies consisting of 110,049,727 people shows a poor negative correlation between the proportion of Sudanese and percentage of single mother households in the United States with a correlation coefficient (R) of -0.106 and weighted average of 6.9%, a difference of 24.2%.
Single Mother Households Correlation Summary
| Measurement | Luxembourger | Sudanese |
| Minimum | 0.28% | 1.0% |
| Maximum | 7.8% | 19.0% |
| Range | 7.5% | 18.0% |
| Mean | 4.1% | 7.0% |
| Median | 4.6% | 6.7% |
| Interquartile 25% (IQ1) | 2.7% | 5.4% |
| Interquartile 75% (IQ3) | 5.2% | 8.2% |
| Interquartile Range (IQR) | 2.5% | 2.8% |
| Standard Deviation (Sample) | 1.8% | 3.0% |
| Standard Deviation (Population) | 1.8% | 3.0% |
Similar Demographics by Single Mother Households
Demographics Similar to Luxembourgers by Single Mother Households
In terms of single mother households, the demographic groups most similar to Luxembourgers are Immigrants from Norway (5.6%, a difference of 0.15%), Australian (5.6%, a difference of 0.22%), Polish (5.6%, a difference of 0.23%), Immigrants from North Macedonia (5.6%, a difference of 0.29%), and Immigrants from France (5.6%, a difference of 0.33%).
| Demographics | Rating | Rank | Single Mother Households |
| Swedes | 99.1 /100 | #52 | Exceptional 5.5% |
| Immigrants | Russia | 99.1 /100 | #53 | Exceptional 5.5% |
| Immigrants | Lebanon | 99.1 /100 | #54 | Exceptional 5.5% |
| Immigrants | Denmark | 99.1 /100 | #55 | Exceptional 5.5% |
| Immigrants | Romania | 99.0 /100 | #56 | Exceptional 5.5% |
| Immigrants | Europe | 99.0 /100 | #57 | Exceptional 5.5% |
| Danes | 98.9 /100 | #58 | Exceptional 5.5% |
| Luxembourgers | 98.7 /100 | #59 | Exceptional 5.6% |
| Immigrants | Norway | 98.7 /100 | #60 | Exceptional 5.6% |
| Australians | 98.7 /100 | #61 | Exceptional 5.6% |
| Poles | 98.6 /100 | #62 | Exceptional 5.6% |
| Immigrants | North Macedonia | 98.6 /100 | #63 | Exceptional 5.6% |
| Immigrants | France | 98.6 /100 | #64 | Exceptional 5.6% |
| Greeks | 98.6 /100 | #65 | Exceptional 5.6% |
| Immigrants | Canada | 98.5 /100 | #66 | Exceptional 5.6% |
Demographics Similar to Sudanese by Single Mother Households
In terms of single mother households, the demographic groups most similar to Sudanese are Immigrants from Sudan (6.9%, a difference of 0.27%), Immigrants from Micronesia (6.9%, a difference of 0.39%), Immigrants from Bangladesh (6.9%, a difference of 0.44%), French American Indian (6.9%, a difference of 0.47%), and Immigrants from Thailand (6.9%, a difference of 0.66%).
| Demographics | Rating | Rank | Single Mother Households |
| Immigrants | Eastern Africa | 4.4 /100 | #218 | Tragic 6.8% |
| Immigrants | Immigrants | 4.3 /100 | #219 | Tragic 6.8% |
| Immigrants | Thailand | 4.0 /100 | #220 | Tragic 6.9% |
| French American Indians | 3.7 /100 | #221 | Tragic 6.9% |
| Immigrants | Bangladesh | 3.7 /100 | #222 | Tragic 6.9% |
| Immigrants | Micronesia | 3.6 /100 | #223 | Tragic 6.9% |
| Immigrants | Sudan | 3.5 /100 | #224 | Tragic 6.9% |
| Sudanese | 3.1 /100 | #225 | Tragic 6.9% |
| Paiute | 2.4 /100 | #226 | Tragic 7.0% |
| Kenyans | 2.3 /100 | #227 | Tragic 7.0% |
| Iroquois | 2.2 /100 | #228 | Tragic 7.0% |
| Immigrants | Kenya | 2.1 /100 | #229 | Tragic 7.0% |
| Creek | 1.6 /100 | #230 | Tragic 7.0% |
| Spanish Americans | 1.6 /100 | #231 | Tragic 7.0% |
| Comanche | 1.5 /100 | #232 | Tragic 7.0% |