Immigrants from Honduras vs Sudanese Single Mother Households
COMPARE
Immigrants from Honduras
Sudanese
Single Mother Households
Single Mother Households Comparison
Immigrants from Honduras
Sudanese
8.2%
SINGLE MOTHER HOUSEHOLDS
0.0/ 100
METRIC RATING
317th/ 347
METRIC RANK
6.9%
SINGLE MOTHER HOUSEHOLDS
3.1/ 100
METRIC RATING
225th/ 347
METRIC RANK
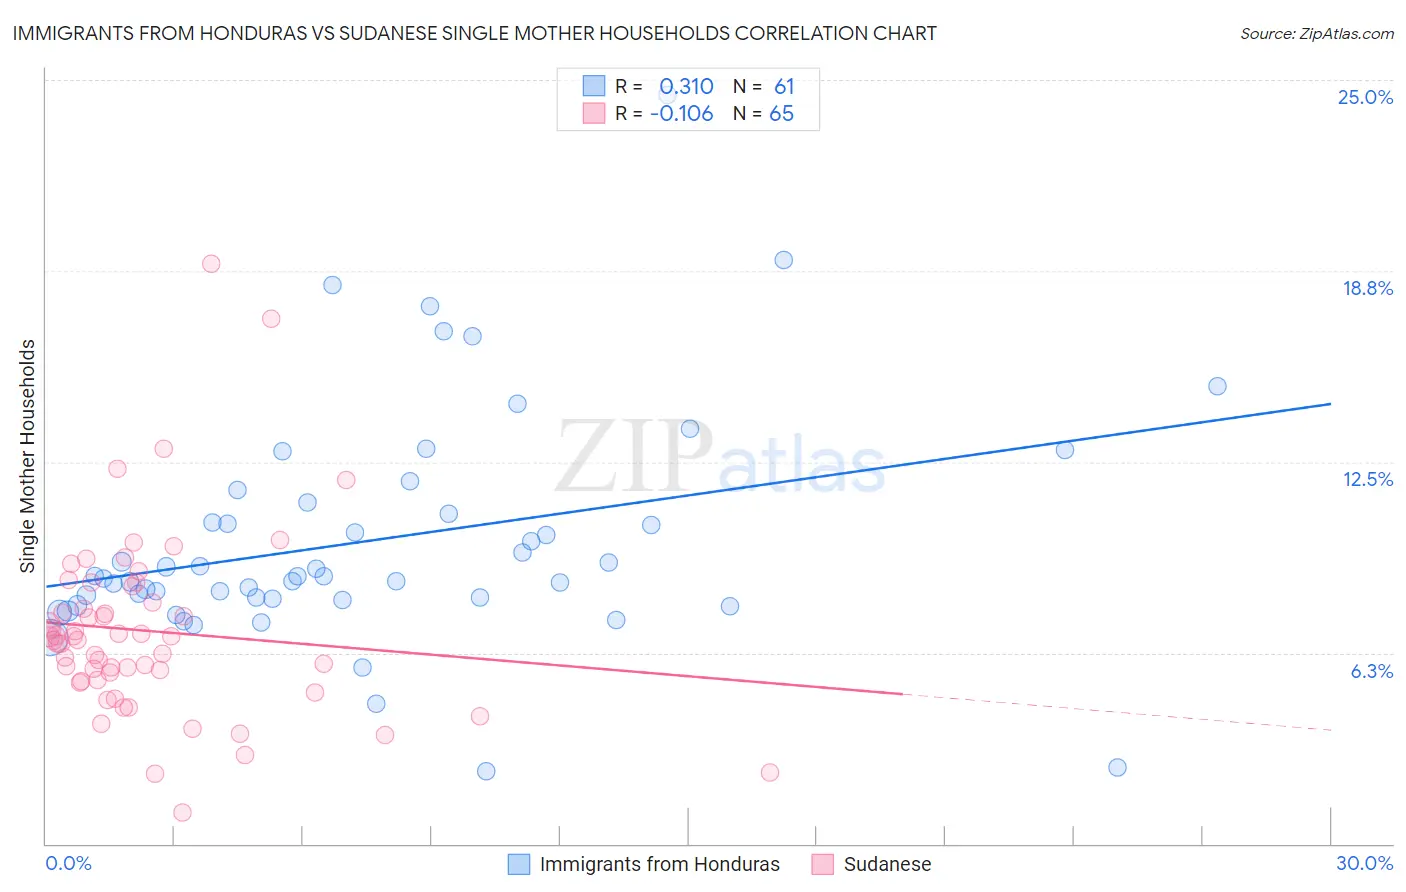
Immigrants from Honduras vs Sudanese Single Mother Households Correlation Chart
The statistical analysis conducted on geographies consisting of 322,086,026 people shows a mild positive correlation between the proportion of Immigrants from Honduras and percentage of single mother households in the United States with a correlation coefficient (R) of 0.310 and weighted average of 8.2%. Similarly, the statistical analysis conducted on geographies consisting of 110,049,727 people shows a poor negative correlation between the proportion of Sudanese and percentage of single mother households in the United States with a correlation coefficient (R) of -0.106 and weighted average of 6.9%, a difference of 18.6%.
Single Mother Households Correlation Summary
| Measurement | Immigrants from Honduras | Sudanese |
| Minimum | 2.4% | 1.0% |
| Maximum | 24.5% | 19.0% |
| Range | 22.1% | 18.0% |
| Mean | 9.9% | 7.0% |
| Median | 8.8% | 6.7% |
| Interquartile 25% (IQ1) | 8.0% | 5.4% |
| Interquartile 75% (IQ3) | 11.0% | 8.2% |
| Interquartile Range (IQR) | 3.0% | 2.8% |
| Standard Deviation (Sample) | 3.8% | 3.0% |
| Standard Deviation (Population) | 3.8% | 3.0% |
Similar Demographics by Single Mother Households
Demographics Similar to Immigrants from Honduras by Single Mother Households
In terms of single mother households, the demographic groups most similar to Immigrants from Honduras are African (8.2%, a difference of 0.14%), Immigrants from Western Africa (8.2%, a difference of 0.28%), Immigrants from Mexico (8.2%, a difference of 0.31%), Immigrants from Grenada (8.2%, a difference of 0.43%), and Senegalese (8.2%, a difference of 0.56%).
| Demographics | Rating | Rank | Single Mother Households |
| Hondurans | 0.0 /100 | #310 | Tragic 8.1% |
| Immigrants | Congo | 0.0 /100 | #311 | Tragic 8.1% |
| Bangladeshis | 0.0 /100 | #312 | Tragic 8.1% |
| Immigrants | Grenada | 0.0 /100 | #313 | Tragic 8.2% |
| Immigrants | Mexico | 0.0 /100 | #314 | Tragic 8.2% |
| Immigrants | Western Africa | 0.0 /100 | #315 | Tragic 8.2% |
| Africans | 0.0 /100 | #316 | Tragic 8.2% |
| Immigrants | Honduras | 0.0 /100 | #317 | Tragic 8.2% |
| Senegalese | 0.0 /100 | #318 | Tragic 8.2% |
| Jamaicans | 0.0 /100 | #319 | Tragic 8.2% |
| Bahamians | 0.0 /100 | #320 | Tragic 8.3% |
| Immigrants | Senegal | 0.0 /100 | #321 | Tragic 8.3% |
| Pima | 0.0 /100 | #322 | Tragic 8.3% |
| Haitians | 0.0 /100 | #323 | Tragic 8.3% |
| Immigrants | Jamaica | 0.0 /100 | #324 | Tragic 8.4% |
Demographics Similar to Sudanese by Single Mother Households
In terms of single mother households, the demographic groups most similar to Sudanese are Immigrants from Sudan (6.9%, a difference of 0.27%), Immigrants from Micronesia (6.9%, a difference of 0.39%), Immigrants from Bangladesh (6.9%, a difference of 0.44%), French American Indian (6.9%, a difference of 0.47%), and Immigrants from Thailand (6.9%, a difference of 0.66%).
| Demographics | Rating | Rank | Single Mother Households |
| Immigrants | Eastern Africa | 4.4 /100 | #218 | Tragic 6.8% |
| Immigrants | Immigrants | 4.3 /100 | #219 | Tragic 6.8% |
| Immigrants | Thailand | 4.0 /100 | #220 | Tragic 6.9% |
| French American Indians | 3.7 /100 | #221 | Tragic 6.9% |
| Immigrants | Bangladesh | 3.7 /100 | #222 | Tragic 6.9% |
| Immigrants | Micronesia | 3.6 /100 | #223 | Tragic 6.9% |
| Immigrants | Sudan | 3.5 /100 | #224 | Tragic 6.9% |
| Sudanese | 3.1 /100 | #225 | Tragic 6.9% |
| Paiute | 2.4 /100 | #226 | Tragic 7.0% |
| Kenyans | 2.3 /100 | #227 | Tragic 7.0% |
| Iroquois | 2.2 /100 | #228 | Tragic 7.0% |
| Immigrants | Kenya | 2.1 /100 | #229 | Tragic 7.0% |
| Creek | 1.6 /100 | #230 | Tragic 7.0% |
| Spanish Americans | 1.6 /100 | #231 | Tragic 7.0% |
| Comanche | 1.5 /100 | #232 | Tragic 7.0% |