Laotian vs French American Indian Family Households

COMPARE

Laotian
Race
Ancestry
AfghanAfricanAlaska NativeAlaskan AthabascanAlbanianAleutAlsatianAmericanApacheArabArapahoArgentineanArmenianAssyrian/Chaldean/SyriacAustralianAustrianBahamianBangladeshiBarbadianBasqueBelgianBelizeanBermudanBhutaneseBlackfeetBolivianBrazilianBritishBritish West IndianBulgarianBurmeseCajunCambodianCanadianCape VerdeanCarpatho RusynCelticCentral AmericanCentral American IndianCherokeeCheyenneChickasawChileanChineseChippewaChoctawColombianColvilleComancheCosta RicanCreeCreekCroatianCrowCubanCypriotCzechCzechoslovakianDanishDelawareDominicanDutchDutch West IndianEastern EuropeanEcuadorianEgyptianEnglishEstonianEthiopianEuropeanFijianFilipinoFinnishFrenchFrench CanadianGermanGerman RussianGhanaianGreekGuamanian/ChamorroGuatemalanGuyaneseHaitianHmongHonduranHopiHoumaHungarianIcelanderIndian (Asian)IndonesianInupiatIranianIraqiIrishIroquoisIsraeliItalianJamaicanJapaneseJordanianKenyanKiowaKoreanLaotianLatvianLebaneseLiberianLithuanianLumbeeLuxembourgerMacedonianMalaysianMalteseMarshalleseMenomineeMexicanMexican American IndianMongolianMoroccanNative HawaiianNavajoNepaleseNew ZealanderNicaraguanNigerianNorthern EuropeanNorwegianOkinawanOsageOttawaPaiutePakistaniPalestinianPanamanianParaguayanPennsylvania GermanPeruvianPimaPolishPortuguesePotawatomiPuebloPuerto RicanPuget Sound SalishRomanianRussianSalvadoranSamoanScandinavianScotch-IrishScottishSeminoleSenegaleseSerbianShoshoneSierra LeoneanSiouxSlavicSlovakSloveneSomaliSouth AfricanSouth AmericanSouth American IndianSoviet UnionSpaniardSpanishSpanish AmericanSpanish American IndianSri LankanSubsaharan AfricanSudaneseSwedishSwissSyrianTaiwaneseThaiTlingit-HaidaTohono O'OdhamTonganTrinidadian and TobagonianTsimshianTurkishU.S. Virgin IslanderUgandanUkrainianUruguayanUteVenezuelanVietnameseWelshWest IndianYakamaYaquiYugoslavianYumanYup'ikZimbabwean
Immigration
NonimmigrantsImmigrantsAfghanistanAfricaAlbaniaArgentinaArmeniaAsiaAustraliaAustriaBahamasBangladeshBarbadosBelarusBelgiumBelizeBoliviaBosnia and HerzegovinaBrazilBulgariaBurma/MyanmarCabo VerdeCambodiaCameroonCanadaCaribbeanCentral AmericaChileChinaColombiaCongoCosta RicaCroatiaCubaCzechoslovakiaDenmarkDominicaDominican RepublicEastern AfricaEastern AsiaEastern EuropeEcuadorEgyptEl SalvadorEnglandEritreaEthiopiaEuropeFijiFranceGermanyGhanaGreeceGrenadaGuatemalaGuyanaHaitiHondurasHong KongHungaryIndiaIndonesiaIranIraqIrelandIsraelItalyJamaicaJapanJordanKazakhstanKenyaKoreaKuwaitLaosLatin AmericaLatviaLebanonLiberiaLithuaniaMalaysiaMexicoMicronesiaMiddle AfricaMoldovaMoroccoNepalNetherlandsNicaraguaNigeriaNorth AmericaNorth MacedoniaNorthern AfricaNorthern EuropeNorwayOceaniaPakistanPanamaPeruPhilippinesPolandPortugalRomaniaRussiaSaudi ArabiaScotlandSenegalSerbiaSierra LeoneSingaporeSomaliaSouth AfricaSouth AmericaSouth Central AsiaSouth Eastern AsiaSouthern EuropeSpainSri LankaSt. Vincent and the GrenadinesSudanSwedenSwitzerlandSyriaTaiwanThailandTrinidad and TobagoTurkeyUgandaUkraineUruguayUzbekistanVenezuelaVietnamWest IndiesWestern AfricaWestern AsiaWestern EuropeYemenZaireZimbabweAzores
French American Indian
Race
Ancestry
AfghanAfricanAlaska NativeAlaskan AthabascanAlbanianAleutAlsatianAmericanApacheArabArapahoArgentineanArmenianAssyrian/Chaldean/SyriacAustralianAustrianBahamianBangladeshiBarbadianBasqueBelgianBelizeanBermudanBhutaneseBlackfeetBolivianBrazilianBritishBritish West IndianBulgarianBurmeseCajunCambodianCanadianCape VerdeanCarpatho RusynCelticCentral AmericanCentral American IndianCherokeeCheyenneChickasawChileanChineseChippewaChoctawColombianColvilleComancheCosta RicanCreeCreekCroatianCrowCubanCypriotCzechCzechoslovakianDanishDelawareDominicanDutchDutch West IndianEastern EuropeanEcuadorianEgyptianEnglishEstonianEthiopianEuropeanFijianFilipinoFinnishFrenchFrench American IndianFrench CanadianGermanGerman RussianGhanaianGreekGuamanian/ChamorroGuatemalanGuyaneseHaitianHmongHonduranHopiHoumaHungarianIcelanderIndian (Asian)IndonesianInupiatIranianIraqiIrishIroquoisIsraeliItalianJamaicanJapaneseJordanianKenyanKiowaKoreanLatvianLebaneseLiberianLithuanianLumbeeLuxembourgerMacedonianMalaysianMalteseMarshalleseMenomineeMexicanMexican American IndianMongolianMoroccanNative HawaiianNavajoNepaleseNew ZealanderNicaraguanNigerianNorthern EuropeanNorwegianOkinawanOsageOttawaPaiutePakistaniPalestinianPanamanianParaguayanPennsylvania GermanPeruvianPimaPolishPortuguesePotawatomiPuebloPuerto RicanPuget Sound SalishRomanianRussianSalvadoranSamoanScandinavianScotch-IrishScottishSeminoleSenegaleseSerbianShoshoneSierra LeoneanSiouxSlavicSlovakSloveneSomaliSouth AfricanSouth AmericanSouth American IndianSoviet UnionSpaniardSpanishSpanish AmericanSpanish American IndianSri LankanSubsaharan AfricanSudaneseSwedishSwissSyrianTaiwaneseThaiTlingit-HaidaTohono O'OdhamTonganTrinidadian and TobagonianTsimshianTurkishU.S. Virgin IslanderUgandanUkrainianUruguayanUteVenezuelanVietnameseWelshWest IndianYakamaYaquiYugoslavianYumanYup'ikZimbabwean
Immigration
NonimmigrantsImmigrantsAfghanistanAfricaAlbaniaArgentinaArmeniaAsiaAustraliaAustriaBahamasBangladeshBarbadosBelarusBelgiumBelizeBoliviaBosnia and HerzegovinaBrazilBulgariaBurma/MyanmarCabo VerdeCambodiaCameroonCanadaCaribbeanCentral AmericaChileChinaColombiaCongoCosta RicaCroatiaCubaCzechoslovakiaDenmarkDominicaDominican RepublicEastern AfricaEastern AsiaEastern EuropeEcuadorEgyptEl SalvadorEnglandEritreaEthiopiaEuropeFijiFranceGermanyGhanaGreeceGrenadaGuatemalaGuyanaHaitiHondurasHong KongHungaryIndiaIndonesiaIranIraqIrelandIsraelItalyJamaicaJapanJordanKazakhstanKenyaKoreaKuwaitLaosLatin AmericaLatviaLebanonLiberiaLithuaniaMalaysiaMexicoMicronesiaMiddle AfricaMoldovaMoroccoNepalNetherlandsNicaraguaNigeriaNorth AmericaNorth MacedoniaNorthern AfricaNorthern EuropeNorwayOceaniaPakistanPanamaPeruPhilippinesPolandPortugalRomaniaRussiaSaudi ArabiaScotlandSenegalSerbiaSierra LeoneSingaporeSomaliaSouth AfricaSouth AmericaSouth Central AsiaSouth Eastern AsiaSouthern EuropeSpainSri LankaSt. Vincent and the GrenadinesSudanSwedenSwitzerlandSyriaTaiwanThailandTrinidad and TobagoTurkeyUgandaUkraineUruguayUzbekistanVenezuelaVietnamWest IndiesWestern AfricaWestern AsiaWestern EuropeYemenZaireZimbabweAzores
Family Households
Income
Poverty
Unemployment
Labor Participation
Family Structure
Vehicle Availability
Education Level
Disability

Family Households Comparison

Laotians

French American Indians

Exceptional
Tragic
65.8%
FAMILY HOUSEHOLDS
99.9/ 100
METRIC RATING
73rd/ 347
METRIC RANK
62.4%
FAMILY HOUSEHOLDS
0.0/ 100
METRIC RATING
297th/ 347
METRIC RANK

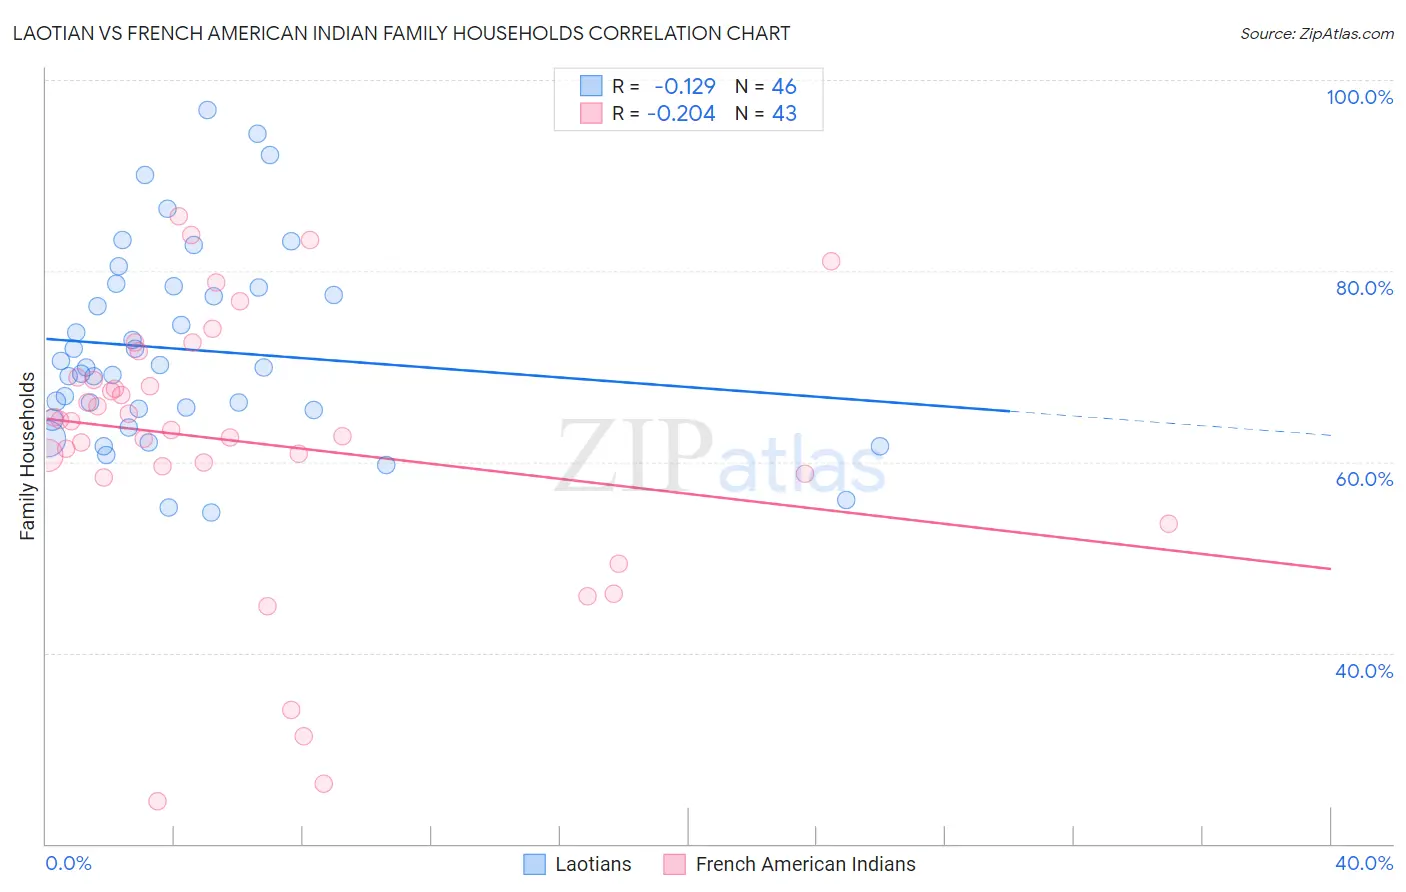
Laotian vs French American Indian Family Households Correlation Chart

The statistical analysis conducted on geographies consisting of 224,743,344 people shows a poor negative correlation between the proportion of Laotians and percentage of family households in the United States with a correlation coefficient (R) of -0.129 and weighted average of 65.8%. Similarly, the statistical analysis conducted on geographies consisting of 131,961,185 people shows a weak negative correlation between the proportion of French American Indians and percentage of family households in the United States with a correlation coefficient (R) of -0.204 and weighted average of 62.4%, a difference of 5.3%.
Laotian vs French American Indian Family Households

Family Households Correlation Summary

MeasurementLaotianFrench American Indian
Minimum54.7%24.4%
Maximum96.9%85.7%
Range42.1%61.3%
Mean71.8%62.0%
Median69.9%64.2%
Interquartile 25% (IQ1)65.4%58.8%
Interquartile 75% (IQ3)78.3%68.8%
Interquartile Range (IQR)12.9%10.1%
Standard Deviation (Sample)10.2%14.3%
Standard Deviation (Population)10.1%14.1%

Similar Demographics by Family Households

Demographics Similar to Laotians by Family Households

In terms of family households, the demographic groups most similar to Laotians are Burmese (65.7%, a difference of 0.040%), Portuguese (65.8%, a difference of 0.080%), Houma (65.7%, a difference of 0.090%), Bhutanese (65.9%, a difference of 0.13%), and Malaysian (65.9%, a difference of 0.15%).
DemographicsRating | RankFamily Households
Fijians
99.9
/100
|
#66
Exceptional
65.9%
Filipinos
99.9
/100
|
#67
Exceptional
65.9%
Japanese
99.9
/100
|
#68
Exceptional
65.9%
Malaysians
99.9
/100
|
#69
Exceptional
65.9%
Immigrants | Afghanistan
99.9
/100
|
#70
Exceptional
65.9%
Bhutanese
99.9
/100
|
#71
Exceptional
65.9%
Portuguese
99.9
/100
|
#72
Exceptional
65.8%
Laotians
99.9
/100
|
#73
Exceptional
65.8%
Burmese
99.9
/100
|
#74
Exceptional
65.7%
Houma
99.9
/100
|
#75
Exceptional
65.7%
Immigrants | Azores
99.8
/100
|
#76
Exceptional
65.6%
Immigrants | South America
99.8
/100
|
#77
Exceptional
65.6%
Yaqui
99.8
/100
|
#78
Exceptional
65.6%
Immigrants | Costa Rica
99.8
/100
|
#79
Exceptional
65.6%
Puget Sound Salish
99.8
/100
|
#80
Exceptional
65.6%

Demographics Similar to French American Indians by Family Households

In terms of family households, the demographic groups most similar to French American Indians are Slovene (62.4%, a difference of 0.010%), Okinawan (62.5%, a difference of 0.020%), Immigrants from Spain (62.4%, a difference of 0.030%), Barbadian (62.5%, a difference of 0.040%), and Immigrants from Kuwait (62.4%, a difference of 0.090%).
DemographicsRating | RankFamily Households
Immigrants | Grenada
0.0
/100
|
#290
Tragic
62.6%
U.S. Virgin Islanders
0.0
/100
|
#291
Tragic
62.6%
Immigrants | Burma/Myanmar
0.0
/100
|
#292
Tragic
62.6%
Immigrants | Sweden
0.0
/100
|
#293
Tragic
62.5%
Barbadians
0.0
/100
|
#294
Tragic
62.5%
Okinawans
0.0
/100
|
#295
Tragic
62.5%
Slovenes
0.0
/100
|
#296
Tragic
62.4%
French American Indians
0.0
/100
|
#297
Tragic
62.4%
Immigrants | Spain
0.0
/100
|
#298
Tragic
62.4%
Immigrants | Kuwait
0.0
/100
|
#299
Tragic
62.4%
Immigrants | Africa
0.0
/100
|
#300
Tragic
62.4%
Immigrants | Albania
0.0
/100
|
#301
Tragic
62.4%
Immigrants | Kenya
0.0
/100
|
#302
Tragic
62.3%
Cree
0.0
/100
|
#303
Tragic
62.3%
Iroquois
0.0
/100
|
#304
Tragic
62.2%