Israeli vs Nonimmigrants Family Households

COMPARE

Israeli
Race
Ancestry
AfghanAfricanAlaska NativeAlaskan AthabascanAlbanianAleutAlsatianAmericanApacheArabArapahoArgentineanArmenianAssyrian/Chaldean/SyriacAustralianAustrianBahamianBangladeshiBarbadianBasqueBelgianBelizeanBermudanBhutaneseBlackfeetBolivianBrazilianBritishBritish West IndianBulgarianBurmeseCajunCambodianCanadianCape VerdeanCarpatho RusynCelticCentral AmericanCentral American IndianCherokeeCheyenneChickasawChileanChineseChippewaChoctawColombianColvilleComancheCosta RicanCreeCreekCroatianCrowCubanCypriotCzechCzechoslovakianDanishDelawareDominicanDutchDutch West IndianEastern EuropeanEcuadorianEgyptianEnglishEstonianEthiopianEuropeanFijianFilipinoFinnishFrenchFrench American IndianFrench CanadianGermanGerman RussianGhanaianGreekGuamanian/ChamorroGuatemalanGuyaneseHaitianHmongHonduranHopiHoumaHungarianIcelanderIndian (Asian)IndonesianInupiatIranianIraqiIrishIroquoisIsraeliItalianJamaicanJapaneseJordanianKenyanKiowaKoreanLaotianLatvianLebaneseLiberianLithuanianLumbeeLuxembourgerMacedonianMalaysianMalteseMarshalleseMenomineeMexicanMexican American IndianMongolianMoroccanNative HawaiianNavajoNepaleseNew ZealanderNicaraguanNigerianNorthern EuropeanNorwegianOkinawanOsageOttawaPaiutePakistaniPalestinianPanamanianParaguayanPennsylvania GermanPeruvianPimaPolishPortuguesePotawatomiPuebloPuerto RicanPuget Sound SalishRomanianRussianSalvadoranSamoanScandinavianScotch-IrishScottishSeminoleSenegaleseSerbianShoshoneSierra LeoneanSiouxSlavicSlovakSloveneSomaliSouth AfricanSouth AmericanSouth American IndianSoviet UnionSpaniardSpanishSpanish AmericanSpanish American IndianSri LankanSubsaharan AfricanSudaneseSwedishSwissSyrianTaiwaneseThaiTlingit-HaidaTohono O'OdhamTonganTrinidadian and TobagonianTsimshianTurkishU.S. Virgin IslanderUgandanUkrainianUruguayanUteVenezuelanVietnameseWelshWest IndianYakamaYaquiYugoslavianYumanYup'ikZimbabwean
Immigration
ImmigrantsAfghanistanAfricaAlbaniaArgentinaArmeniaAsiaAustraliaAustriaBahamasBangladeshBarbadosBelarusBelgiumBelizeBoliviaBosnia and HerzegovinaBrazilBulgariaBurma/MyanmarCabo VerdeCambodiaCameroonCanadaCaribbeanCentral AmericaChileChinaColombiaCongoCosta RicaCroatiaCubaCzechoslovakiaDenmarkDominicaDominican RepublicEastern AfricaEastern AsiaEastern EuropeEcuadorEgyptEl SalvadorEnglandEritreaEthiopiaEuropeFijiFranceGermanyGhanaGreeceGrenadaGuatemalaGuyanaHaitiHondurasHong KongHungaryIndiaIndonesiaIranIraqIrelandIsraelItalyJamaicaJapanJordanKazakhstanKenyaKoreaKuwaitLaosLatin AmericaLatviaLebanonLiberiaLithuaniaMalaysiaMexicoMicronesiaMiddle AfricaMoldovaMoroccoNepalNetherlandsNicaraguaNigeriaNorth AmericaNorth MacedoniaNorthern AfricaNorthern EuropeNorwayOceaniaPakistanPanamaPeruPhilippinesPolandPortugalRomaniaRussiaSaudi ArabiaScotlandSenegalSerbiaSierra LeoneSingaporeSomaliaSouth AfricaSouth AmericaSouth Central AsiaSouth Eastern AsiaSouthern EuropeSpainSri LankaSt. Vincent and the GrenadinesSudanSwedenSwitzerlandSyriaTaiwanThailandTrinidad and TobagoTurkeyUgandaUkraineUruguayUzbekistanVenezuelaVietnamWest IndiesWestern AfricaWestern AsiaWestern EuropeYemenZaireZimbabweAzores
Nonimmigrants
Race
Ancestry
AfghanAfricanAlaska NativeAlaskan AthabascanAlbanianAleutAlsatianAmericanApacheArabArapahoArgentineanArmenianAssyrian/Chaldean/SyriacAustralianAustrianBahamianBangladeshiBarbadianBasqueBelgianBelizeanBermudanBhutaneseBlackfeetBolivianBrazilianBritishBritish West IndianBulgarianBurmeseCajunCambodianCanadianCape VerdeanCarpatho RusynCelticCentral AmericanCentral American IndianCherokeeCheyenneChickasawChileanChineseChippewaChoctawColombianColvilleComancheCosta RicanCreeCreekCroatianCrowCubanCypriotCzechCzechoslovakianDanishDelawareDominicanDutchDutch West IndianEastern EuropeanEcuadorianEgyptianEnglishEstonianEthiopianEuropeanFijianFilipinoFinnishFrenchFrench American IndianFrench CanadianGermanGerman RussianGhanaianGreekGuamanian/ChamorroGuatemalanGuyaneseHaitianHmongHonduranHopiHoumaHungarianIcelanderIndian (Asian)IndonesianInupiatIranianIraqiIrishIroquoisItalianJamaicanJapaneseJordanianKenyanKiowaKoreanLaotianLatvianLebaneseLiberianLithuanianLumbeeLuxembourgerMacedonianMalaysianMalteseMarshalleseMenomineeMexicanMexican American IndianMongolianMoroccanNative HawaiianNavajoNepaleseNew ZealanderNicaraguanNigerianNorthern EuropeanNorwegianOkinawanOsageOttawaPaiutePakistaniPalestinianPanamanianParaguayanPennsylvania GermanPeruvianPimaPolishPortuguesePotawatomiPuebloPuerto RicanPuget Sound SalishRomanianRussianSalvadoranSamoanScandinavianScotch-IrishScottishSeminoleSenegaleseSerbianShoshoneSierra LeoneanSiouxSlavicSlovakSloveneSomaliSouth AfricanSouth AmericanSouth American IndianSoviet UnionSpaniardSpanishSpanish AmericanSpanish American IndianSri LankanSubsaharan AfricanSudaneseSwedishSwissSyrianTaiwaneseThaiTlingit-HaidaTohono O'OdhamTonganTrinidadian and TobagonianTsimshianTurkishU.S. Virgin IslanderUgandanUkrainianUruguayanUteVenezuelanVietnameseWelshWest IndianYakamaYaquiYugoslavianYumanYup'ikZimbabwean
Immigration
NonimmigrantsImmigrantsAfghanistanAfricaAlbaniaArgentinaArmeniaAsiaAustraliaAustriaBahamasBangladeshBarbadosBelarusBelgiumBelizeBoliviaBosnia and HerzegovinaBrazilBulgariaBurma/MyanmarCabo VerdeCambodiaCameroonCanadaCaribbeanCentral AmericaChileChinaColombiaCongoCosta RicaCroatiaCubaCzechoslovakiaDenmarkDominicaDominican RepublicEastern AfricaEastern AsiaEastern EuropeEcuadorEgyptEl SalvadorEnglandEritreaEthiopiaEuropeFijiFranceGermanyGhanaGreeceGrenadaGuatemalaGuyanaHaitiHondurasHong KongHungaryIndiaIndonesiaIranIraqIrelandIsraelItalyJamaicaJapanJordanKazakhstanKenyaKoreaKuwaitLaosLatin AmericaLatviaLebanonLiberiaLithuaniaMalaysiaMexicoMicronesiaMiddle AfricaMoldovaMoroccoNepalNetherlandsNicaraguaNigeriaNorth AmericaNorth MacedoniaNorthern AfricaNorthern EuropeNorwayOceaniaPakistanPanamaPeruPhilippinesPolandPortugalRomaniaRussiaSaudi ArabiaScotlandSenegalSerbiaSierra LeoneSingaporeSomaliaSouth AfricaSouth AmericaSouth Central AsiaSouth Eastern AsiaSouthern EuropeSpainSri LankaSt. Vincent and the GrenadinesSudanSwedenSwitzerlandSyriaTaiwanThailandTrinidad and TobagoTurkeyUgandaUkraineUruguayUzbekistanVenezuelaVietnamWest IndiesWestern AfricaWestern AsiaWestern EuropeYemenZaireZimbabweAzores
Family Households
Income
Poverty
Unemployment
Labor Participation
Family Structure
Vehicle Availability
Education Level
Disability

Family Households Comparison

Israelis

Nonimmigrants

Tragic
Exceptional
63.1%
FAMILY HOUSEHOLDS
0.4/ 100
METRIC RATING
267th/ 347
METRIC RANK
64.8%
FAMILY HOUSEHOLDS
90.1/ 100
METRIC RATING
131st/ 347
METRIC RANK

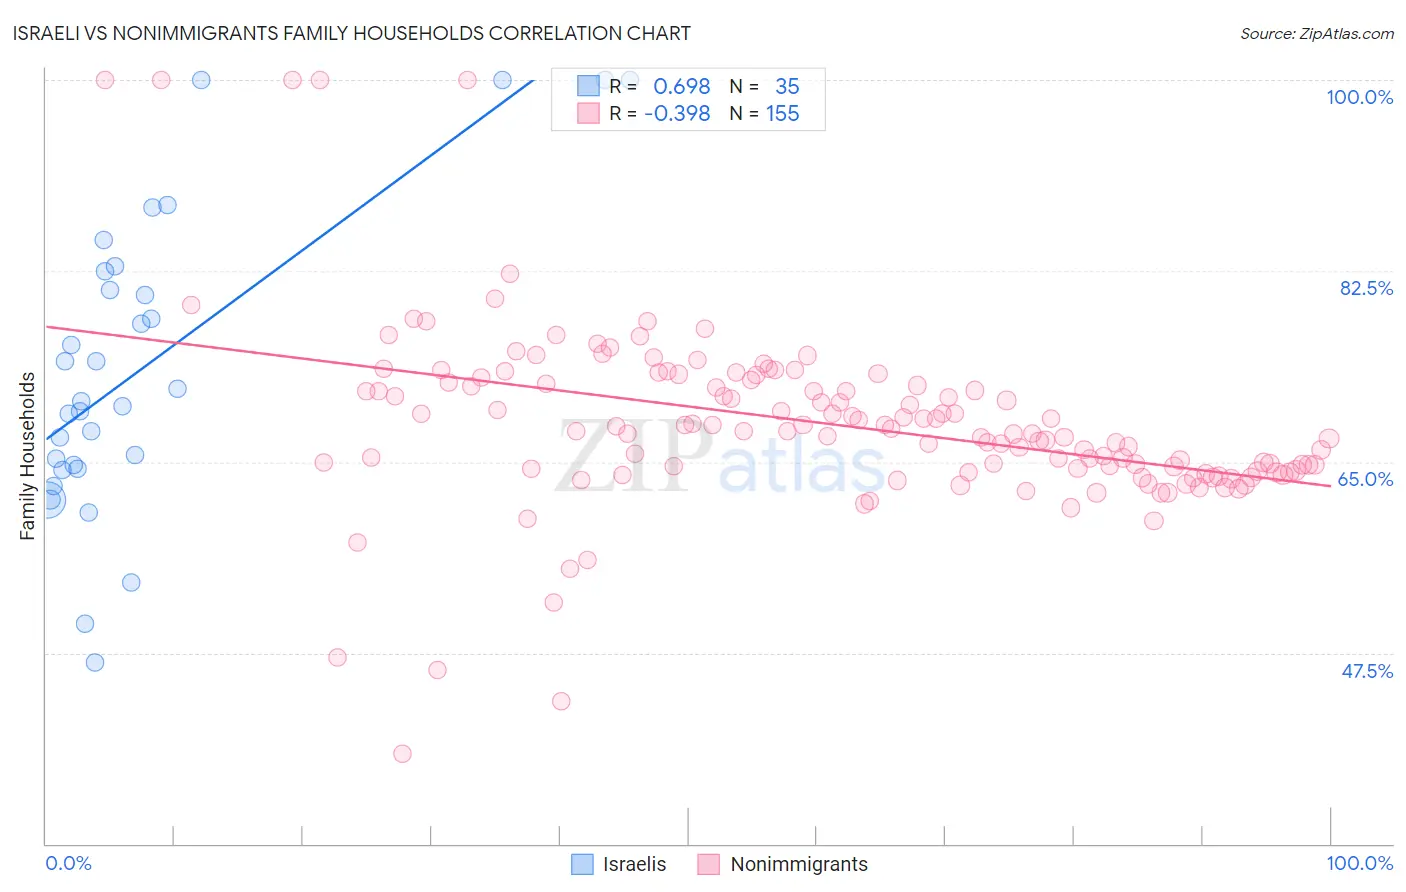
Israeli vs Nonimmigrants Family Households Correlation Chart

The statistical analysis conducted on geographies consisting of 210,999,520 people shows a significant positive correlation between the proportion of Israelis and percentage of family households in the United States with a correlation coefficient (R) of 0.698 and weighted average of 63.1%. Similarly, the statistical analysis conducted on geographies consisting of 584,651,779 people shows a mild negative correlation between the proportion of Nonimmigrants and percentage of family households in the United States with a correlation coefficient (R) of -0.398 and weighted average of 64.8%, a difference of 2.6%.
Israeli vs Nonimmigrants Family Households

Family Households Correlation Summary

MeasurementIsraeliNonimmigrants
Minimum46.6%38.2%
Maximum100.0%100.0%
Range53.4%61.8%
Mean73.6%68.5%
Median70.5%67.8%
Interquartile 25% (IQ1)64.4%64.2%
Interquartile 75% (IQ3)82.5%72.3%
Interquartile Range (IQR)18.1%8.1%
Standard Deviation (Sample)13.8%8.6%
Standard Deviation (Population)13.6%8.6%

Similar Demographics by Family Households

Demographics Similar to Israelis by Family Households

In terms of family households, the demographic groups most similar to Israelis are Immigrants from Western Africa (63.1%, a difference of 0.040%), Colville (63.2%, a difference of 0.050%), Immigrants from Singapore (63.1%, a difference of 0.050%), Cheyenne (63.2%, a difference of 0.060%), and Kenyan (63.2%, a difference of 0.060%).
DemographicsRating | RankFamily Households
Cypriots
0.6
/100
|
#260
Tragic
63.2%
Immigrants | Russia
0.6
/100
|
#261
Tragic
63.2%
Immigrants | Ireland
0.6
/100
|
#262
Tragic
63.2%
Cheyenne
0.5
/100
|
#263
Tragic
63.2%
Kenyans
0.5
/100
|
#264
Tragic
63.2%
Colville
0.5
/100
|
#265
Tragic
63.2%
Immigrants | Western Africa
0.5
/100
|
#266
Tragic
63.1%
Israelis
0.4
/100
|
#267
Tragic
63.1%
Immigrants | Singapore
0.4
/100
|
#268
Tragic
63.1%
Yugoslavians
0.4
/100
|
#269
Tragic
63.1%
Immigrants | Austria
0.3
/100
|
#270
Tragic
63.1%
Immigrants | Croatia
0.3
/100
|
#271
Tragic
63.1%
Immigrants | Turkey
0.3
/100
|
#272
Tragic
63.1%
Immigrants | Kazakhstan
0.3
/100
|
#273
Tragic
63.1%
Lumbee
0.3
/100
|
#274
Tragic
63.1%

Demographics Similar to Nonimmigrants by Family Households

In terms of family households, the demographic groups most similar to Nonimmigrants are Immigrants from Italy (64.8%, a difference of 0.010%), Cajun (64.8%, a difference of 0.020%), Belizean (64.8%, a difference of 0.030%), Immigrants from Ecuador (64.8%, a difference of 0.050%), and Italian (64.8%, a difference of 0.070%).
DemographicsRating | RankFamily Households
Immigrants | Argentina
92.8
/100
|
#124
Exceptional
64.9%
Immigrants | Belize
92.7
/100
|
#125
Exceptional
64.9%
Panamanians
92.4
/100
|
#126
Exceptional
64.8%
Immigrants | Panama
92.0
/100
|
#127
Exceptional
64.8%
Italians
91.9
/100
|
#128
Exceptional
64.8%
Immigrants | Ecuador
91.4
/100
|
#129
Exceptional
64.8%
Immigrants | Italy
90.2
/100
|
#130
Exceptional
64.8%
Immigrants | Nonimmigrants
90.1
/100
|
#131
Exceptional
64.8%
Cajuns
89.4
/100
|
#132
Excellent
64.8%
Belizeans
89.3
/100
|
#133
Excellent
64.8%
Greeks
88.1
/100
|
#134
Excellent
64.7%
Maltese
87.4
/100
|
#135
Excellent
64.7%
Immigrants | China
86.6
/100
|
#136
Excellent
64.7%
Immigrants | Scotland
86.4
/100
|
#137
Excellent
64.7%
Basques
85.5
/100
|
#138
Excellent
64.7%