Iranian vs Greek Family Households with Children

COMPARE

Iranian
Race
Ancestry
AfghanAfricanAlaska NativeAlaskan AthabascanAlbanianAleutAlsatianAmericanApacheArabArapahoArgentineanArmenianAssyrian/Chaldean/SyriacAustralianAustrianBahamianBangladeshiBarbadianBasqueBelgianBelizeanBermudanBhutaneseBlackfeetBolivianBrazilianBritishBritish West IndianBulgarianBurmeseCajunCambodianCanadianCape VerdeanCarpatho RusynCelticCentral AmericanCentral American IndianCherokeeCheyenneChickasawChileanChineseChippewaChoctawColombianColvilleComancheCosta RicanCreeCreekCroatianCrowCubanCypriotCzechCzechoslovakianDanishDelawareDominicanDutchDutch West IndianEastern EuropeanEcuadorianEgyptianEnglishEstonianEthiopianEuropeanFijianFilipinoFinnishFrenchFrench American IndianFrench CanadianGermanGerman RussianGhanaianGuamanian/ChamorroGuatemalanGuyaneseHaitianHmongHonduranHopiHoumaHungarianIcelanderIndian (Asian)IndonesianInupiatIranianIraqiIrishIroquoisIsraeliItalianJamaicanJapaneseJordanianKenyanKiowaKoreanLaotianLatvianLebaneseLiberianLithuanianLumbeeLuxembourgerMacedonianMalaysianMalteseMarshalleseMenomineeMexicanMexican American IndianMongolianMoroccanNative HawaiianNavajoNepaleseNew ZealanderNicaraguanNigerianNorthern EuropeanNorwegianOkinawanOsageOttawaPaiutePakistaniPalestinianPanamanianParaguayanPennsylvania GermanPeruvianPimaPolishPortuguesePotawatomiPuebloPuerto RicanPuget Sound SalishRomanianRussianSalvadoranSamoanScandinavianScotch-IrishScottishSeminoleSenegaleseSerbianShoshoneSierra LeoneanSiouxSlavicSlovakSloveneSomaliSouth AfricanSouth AmericanSouth American IndianSoviet UnionSpaniardSpanishSpanish AmericanSpanish American IndianSri LankanSubsaharan AfricanSudaneseSwedishSwissSyrianTaiwaneseThaiTlingit-HaidaTohono O'OdhamTonganTrinidadian and TobagonianTsimshianTurkishU.S. Virgin IslanderUgandanUkrainianUruguayanUteVenezuelanVietnameseWelshWest IndianYakamaYaquiYugoslavianYumanYup'ikZimbabwean
Immigration
NonimmigrantsImmigrantsAfghanistanAfricaAlbaniaArgentinaArmeniaAsiaAustraliaAustriaBahamasBangladeshBarbadosBelarusBelgiumBelizeBoliviaBosnia and HerzegovinaBrazilBulgariaBurma/MyanmarCabo VerdeCambodiaCameroonCanadaCaribbeanCentral AmericaChileChinaColombiaCongoCosta RicaCroatiaCubaCzechoslovakiaDenmarkDominicaDominican RepublicEastern AfricaEastern AsiaEastern EuropeEcuadorEgyptEl SalvadorEnglandEritreaEthiopiaEuropeFijiFranceGermanyGhanaGreeceGrenadaGuatemalaGuyanaHaitiHondurasHong KongHungaryIndiaIndonesiaIranIraqIrelandIsraelItalyJamaicaJapanJordanKazakhstanKenyaKoreaKuwaitLaosLatin AmericaLatviaLebanonLiberiaLithuaniaMalaysiaMexicoMicronesiaMiddle AfricaMoldovaMoroccoNepalNetherlandsNicaraguaNigeriaNorth AmericaNorth MacedoniaNorthern AfricaNorthern EuropeNorwayOceaniaPakistanPanamaPeruPhilippinesPolandPortugalRomaniaRussiaSaudi ArabiaScotlandSenegalSerbiaSierra LeoneSingaporeSomaliaSouth AfricaSouth AmericaSouth Central AsiaSouth Eastern AsiaSouthern EuropeSpainSri LankaSt. Vincent and the GrenadinesSudanSwedenSwitzerlandSyriaTaiwanThailandTrinidad and TobagoTurkeyUgandaUkraineUruguayUzbekistanVenezuelaVietnamWest IndiesWestern AfricaWestern AsiaWestern EuropeYemenZaireZimbabweAzores
Greek
Race
Ancestry
AfghanAfricanAlaska NativeAlaskan AthabascanAlbanianAleutAlsatianAmericanApacheArabArapahoArgentineanArmenianAssyrian/Chaldean/SyriacAustralianAustrianBahamianBangladeshiBarbadianBasqueBelgianBelizeanBermudanBhutaneseBlackfeetBolivianBrazilianBritishBritish West IndianBulgarianBurmeseCajunCambodianCanadianCape VerdeanCarpatho RusynCelticCentral AmericanCentral American IndianCherokeeCheyenneChickasawChileanChineseChippewaChoctawColombianColvilleComancheCosta RicanCreeCreekCroatianCrowCubanCypriotCzechCzechoslovakianDanishDelawareDominicanDutchDutch West IndianEastern EuropeanEcuadorianEgyptianEnglishEstonianEthiopianEuropeanFijianFilipinoFinnishFrenchFrench American IndianFrench CanadianGermanGerman RussianGhanaianGreekGuamanian/ChamorroGuatemalanGuyaneseHaitianHmongHonduranHopiHoumaHungarianIcelanderIndian (Asian)IndonesianInupiatIraqiIrishIroquoisIsraeliItalianJamaicanJapaneseJordanianKenyanKiowaKoreanLaotianLatvianLebaneseLiberianLithuanianLumbeeLuxembourgerMacedonianMalaysianMalteseMarshalleseMenomineeMexicanMexican American IndianMongolianMoroccanNative HawaiianNavajoNepaleseNew ZealanderNicaraguanNigerianNorthern EuropeanNorwegianOkinawanOsageOttawaPaiutePakistaniPalestinianPanamanianParaguayanPennsylvania GermanPeruvianPimaPolishPortuguesePotawatomiPuebloPuerto RicanPuget Sound SalishRomanianRussianSalvadoranSamoanScandinavianScotch-IrishScottishSeminoleSenegaleseSerbianShoshoneSierra LeoneanSiouxSlavicSlovakSloveneSomaliSouth AfricanSouth AmericanSouth American IndianSoviet UnionSpaniardSpanishSpanish AmericanSpanish American IndianSri LankanSubsaharan AfricanSudaneseSwedishSwissSyrianTaiwaneseThaiTlingit-HaidaTohono O'OdhamTonganTrinidadian and TobagonianTsimshianTurkishU.S. Virgin IslanderUgandanUkrainianUruguayanUteVenezuelanVietnameseWelshWest IndianYakamaYaquiYugoslavianYumanYup'ikZimbabwean
Immigration
NonimmigrantsImmigrantsAfghanistanAfricaAlbaniaArgentinaArmeniaAsiaAustraliaAustriaBahamasBangladeshBarbadosBelarusBelgiumBelizeBoliviaBosnia and HerzegovinaBrazilBulgariaBurma/MyanmarCabo VerdeCambodiaCameroonCanadaCaribbeanCentral AmericaChileChinaColombiaCongoCosta RicaCroatiaCubaCzechoslovakiaDenmarkDominicaDominican RepublicEastern AfricaEastern AsiaEastern EuropeEcuadorEgyptEl SalvadorEnglandEritreaEthiopiaEuropeFijiFranceGermanyGhanaGreeceGrenadaGuatemalaGuyanaHaitiHondurasHong KongHungaryIndiaIndonesiaIranIraqIrelandIsraelItalyJamaicaJapanJordanKazakhstanKenyaKoreaKuwaitLaosLatin AmericaLatviaLebanonLiberiaLithuaniaMalaysiaMexicoMicronesiaMiddle AfricaMoldovaMoroccoNepalNetherlandsNicaraguaNigeriaNorth AmericaNorth MacedoniaNorthern AfricaNorthern EuropeNorwayOceaniaPakistanPanamaPeruPhilippinesPolandPortugalRomaniaRussiaSaudi ArabiaScotlandSenegalSerbiaSierra LeoneSingaporeSomaliaSouth AfricaSouth AmericaSouth Central AsiaSouth Eastern AsiaSouthern EuropeSpainSri LankaSt. Vincent and the GrenadinesSudanSwedenSwitzerlandSyriaTaiwanThailandTrinidad and TobagoTurkeyUgandaUkraineUruguayUzbekistanVenezuelaVietnamWest IndiesWestern AfricaWestern AsiaWestern EuropeYemenZaireZimbabweAzores
Family Households with Children
Income
Poverty
Unemployment
Labor Participation
Family Structure
Vehicle Availability
Education Level
Disability

Family Households with Children Comparison

Iranians

Greeks

Excellent
Poor
27.7%
FAMILY HOUSEHOLDS WITH CHILDREN
85.2/ 100
METRIC RATING
133rd/ 347
METRIC RANK
27.1%
FAMILY HOUSEHOLDS WITH CHILDREN
11.4/ 100
METRIC RATING
218th/ 347
METRIC RANK

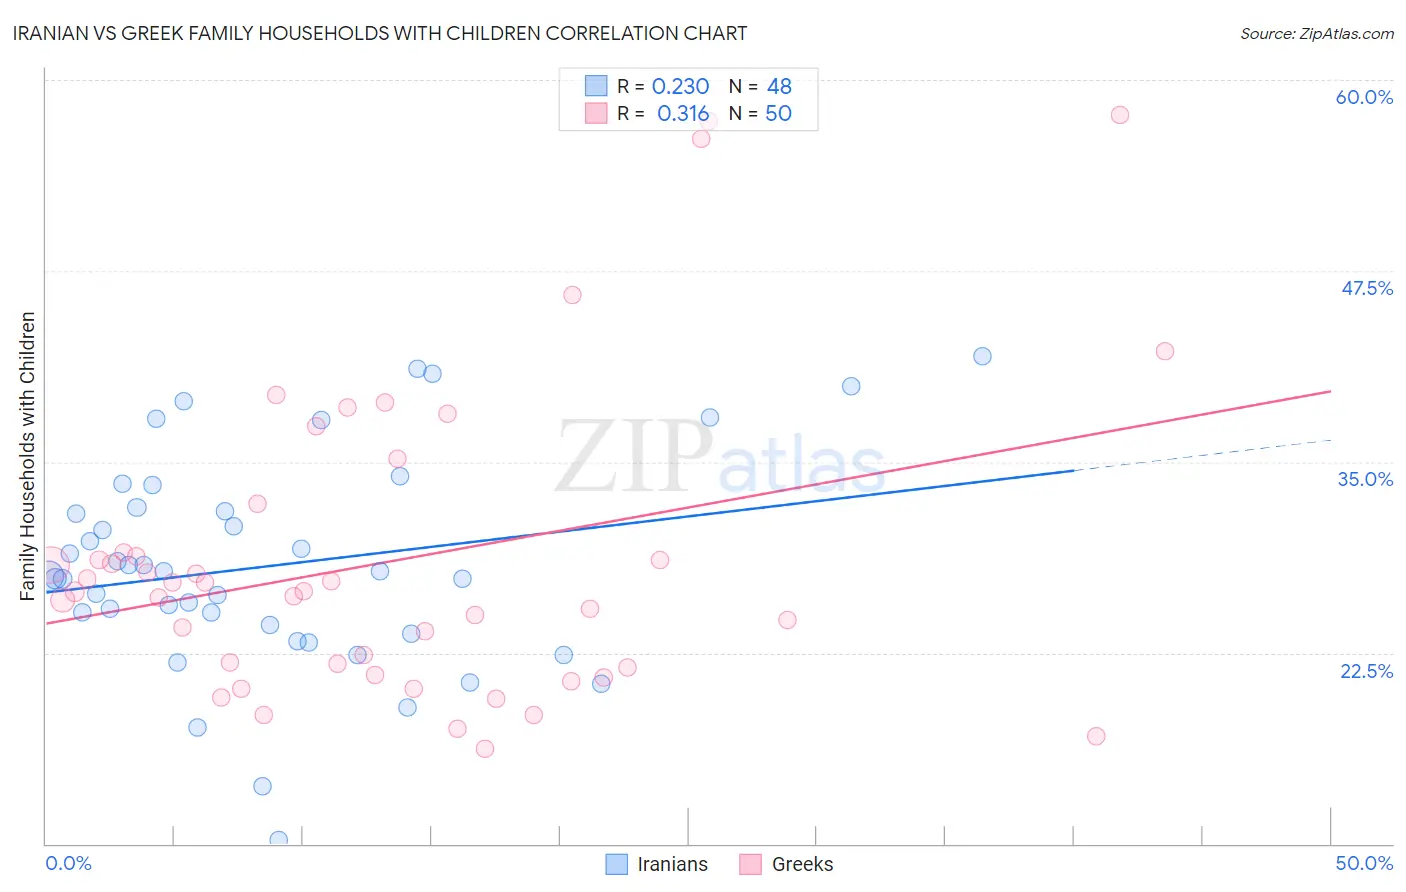
Iranian vs Greek Family Households with Children Correlation Chart

The statistical analysis conducted on geographies consisting of 316,530,986 people shows a weak positive correlation between the proportion of Iranians and percentage of family households with children in the United States with a correlation coefficient (R) of 0.230 and weighted average of 27.7%. Similarly, the statistical analysis conducted on geographies consisting of 482,098,294 people shows a mild positive correlation between the proportion of Greeks and percentage of family households with children in the United States with a correlation coefficient (R) of 0.316 and weighted average of 27.1%, a difference of 2.1%.
Iranian vs Greek Family Households with Children

Family Households with Children Correlation Summary

MeasurementIranianGreek
Minimum10.2%16.2%
Maximum41.9%57.7%
Range31.7%41.5%
Mean28.2%28.5%
Median27.7%26.5%
Interquartile 25% (IQ1)24.0%21.5%
Interquartile 75% (IQ3)31.9%29.1%
Interquartile Range (IQR)7.9%7.6%
Standard Deviation (Sample)7.0%10.0%
Standard Deviation (Population)6.9%9.9%

Similar Demographics by Family Households with Children

Demographics Similar to Iranians by Family Households with Children

In terms of family households with children, the demographic groups most similar to Iranians are Immigrants from Panama (27.7%, a difference of 0.010%), Immigrants from Belize (27.7%, a difference of 0.020%), Immigrants from Ecuador (27.7%, a difference of 0.030%), Immigrants from Portugal (27.7%, a difference of 0.040%), and Immigrants from Dominican Republic (27.7%, a difference of 0.060%).
DemographicsRating | RankFamily Households with Children
Immigrants | Ethiopia
90.5
/100
|
#126
Exceptional
27.8%
Belizeans
90.0
/100
|
#127
Exceptional
27.8%
Syrians
89.7
/100
|
#128
Excellent
27.8%
Immigrants | Eritrea
89.4
/100
|
#129
Excellent
27.8%
Cajuns
87.6
/100
|
#130
Excellent
27.7%
Lebanese
87.4
/100
|
#131
Excellent
27.7%
Immigrants | Belize
85.7
/100
|
#132
Excellent
27.7%
Iranians
85.2
/100
|
#133
Excellent
27.7%
Immigrants | Panama
84.9
/100
|
#134
Excellent
27.7%
Immigrants | Ecuador
84.6
/100
|
#135
Excellent
27.7%
Immigrants | Portugal
84.1
/100
|
#136
Excellent
27.7%
Immigrants | Dominican Republic
83.9
/100
|
#137
Excellent
27.7%
Uruguayans
83.2
/100
|
#138
Excellent
27.7%
Vietnamese
82.6
/100
|
#139
Excellent
27.7%
Spanish
81.8
/100
|
#140
Excellent
27.7%

Demographics Similar to Greeks by Family Households with Children

In terms of family households with children, the demographic groups most similar to Greeks are Cuban (27.1%, a difference of 0.040%), U.S. Virgin Islander (27.1%, a difference of 0.040%), Immigrants from Japan (27.1%, a difference of 0.040%), African (27.2%, a difference of 0.080%), and Northern European (27.2%, a difference of 0.080%).
DemographicsRating | RankFamily Households with Children
Welsh
14.2
/100
|
#211
Poor
27.2%
Immigrants | Dominica
13.9
/100
|
#212
Poor
27.2%
Okinawans
13.7
/100
|
#213
Poor
27.2%
Africans
13.0
/100
|
#214
Poor
27.2%
Northern Europeans
12.8
/100
|
#215
Poor
27.2%
Cubans
12.2
/100
|
#216
Poor
27.1%
U.S. Virgin Islanders
12.1
/100
|
#217
Poor
27.1%
Greeks
11.4
/100
|
#218
Poor
27.1%
Immigrants | Japan
10.7
/100
|
#219
Poor
27.1%
Austrians
9.9
/100
|
#220
Tragic
27.1%
New Zealanders
9.6
/100
|
#221
Tragic
27.1%
Paraguayans
9.4
/100
|
#222
Tragic
27.1%
Pima
9.2
/100
|
#223
Tragic
27.1%
Germans
8.7
/100
|
#224
Tragic
27.1%
Canadians
7.5
/100
|
#225
Tragic
27.1%