Guamanian/Chamorro vs Greek Family Households with Children
COMPARE
Guamanian/Chamorro
Greek
Family Households with Children
Family Households with Children Comparison
Guamanians/Chamorros
Greeks
29.7%
FAMILY HOUSEHOLDS WITH CHILDREN
100.0/ 100
METRIC RATING
24th/ 347
METRIC RANK
27.1%
FAMILY HOUSEHOLDS WITH CHILDREN
11.4/ 100
METRIC RATING
218th/ 347
METRIC RANK
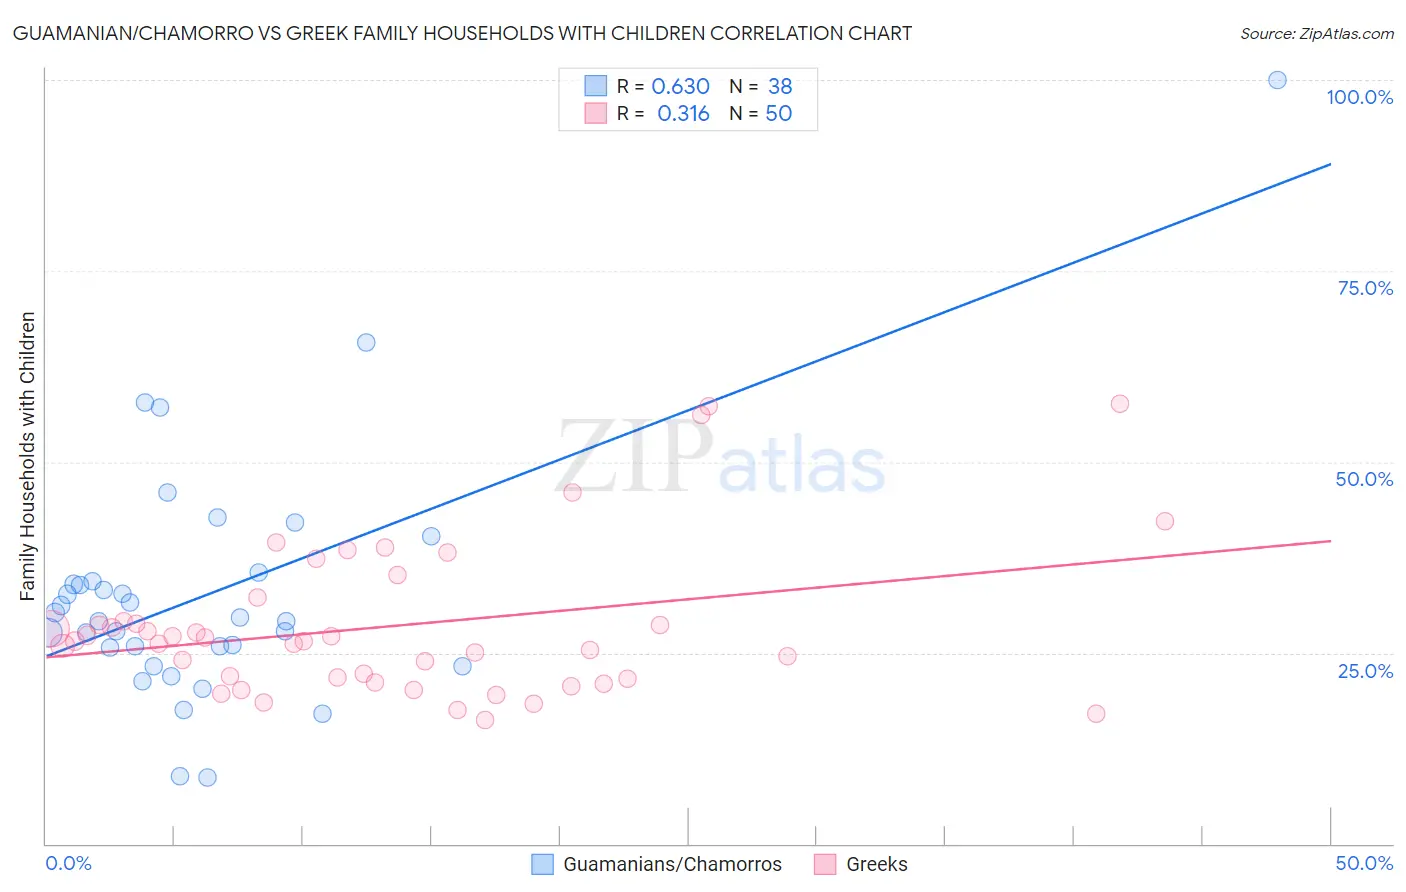
Guamanian/Chamorro vs Greek Family Households with Children Correlation Chart
The statistical analysis conducted on geographies consisting of 221,827,817 people shows a significant positive correlation between the proportion of Guamanians/Chamorros and percentage of family households with children in the United States with a correlation coefficient (R) of 0.630 and weighted average of 29.7%. Similarly, the statistical analysis conducted on geographies consisting of 482,098,294 people shows a mild positive correlation between the proportion of Greeks and percentage of family households with children in the United States with a correlation coefficient (R) of 0.316 and weighted average of 27.1%, a difference of 9.5%.
Family Households with Children Correlation Summary
| Measurement | Guamanian/Chamorro | Greek |
| Minimum | 8.6% | 16.2% |
| Maximum | 100.0% | 57.7% |
| Range | 91.4% | 41.5% |
| Mean | 32.8% | 28.5% |
| Median | 29.4% | 26.5% |
| Interquartile 25% (IQ1) | 25.8% | 21.5% |
| Interquartile 75% (IQ3) | 34.4% | 29.1% |
| Interquartile Range (IQR) | 8.7% | 7.6% |
| Standard Deviation (Sample) | 16.3% | 10.0% |
| Standard Deviation (Population) | 16.1% | 9.9% |
Similar Demographics by Family Households with Children
Demographics Similar to Guamanians/Chamorros by Family Households with Children
In terms of family households with children, the demographic groups most similar to Guamanians/Chamorros are Mexican American Indian (29.7%, a difference of 0.10%), Immigrants from Latin America (29.7%, a difference of 0.10%), Malaysian (29.8%, a difference of 0.37%), Immigrants from Laos (29.8%, a difference of 0.41%), and Immigrants from El Salvador (29.8%, a difference of 0.45%).
| Demographics | Rating | Rank | Family Households with Children |
| Hispanics or Latinos | 100.0 /100 | #17 | Exceptional 29.9% |
| Salvadorans | 100.0 /100 | #18 | Exceptional 29.9% |
| Alaska Natives | 100.0 /100 | #19 | Exceptional 29.9% |
| Immigrants | El Salvador | 100.0 /100 | #20 | Exceptional 29.8% |
| Immigrants | Laos | 100.0 /100 | #21 | Exceptional 29.8% |
| Malaysians | 100.0 /100 | #22 | Exceptional 29.8% |
| Mexican American Indians | 100.0 /100 | #23 | Exceptional 29.7% |
| Guamanians/Chamorros | 100.0 /100 | #24 | Exceptional 29.7% |
| Immigrants | Latin America | 100.0 /100 | #25 | Exceptional 29.7% |
| Sri Lankans | 100.0 /100 | #26 | Exceptional 29.5% |
| Immigrants | Vietnam | 100.0 /100 | #27 | Exceptional 29.5% |
| Samoans | 100.0 /100 | #28 | Exceptional 29.5% |
| Bolivians | 100.0 /100 | #29 | Exceptional 29.5% |
| Yuman | 100.0 /100 | #30 | Exceptional 29.5% |
| Japanese | 100.0 /100 | #31 | Exceptional 29.4% |
Demographics Similar to Greeks by Family Households with Children
In terms of family households with children, the demographic groups most similar to Greeks are Cuban (27.1%, a difference of 0.040%), U.S. Virgin Islander (27.1%, a difference of 0.040%), Immigrants from Japan (27.1%, a difference of 0.040%), African (27.2%, a difference of 0.080%), and Northern European (27.2%, a difference of 0.080%).
| Demographics | Rating | Rank | Family Households with Children |
| Welsh | 14.2 /100 | #211 | Poor 27.2% |
| Immigrants | Dominica | 13.9 /100 | #212 | Poor 27.2% |
| Okinawans | 13.7 /100 | #213 | Poor 27.2% |
| Africans | 13.0 /100 | #214 | Poor 27.2% |
| Northern Europeans | 12.8 /100 | #215 | Poor 27.2% |
| Cubans | 12.2 /100 | #216 | Poor 27.1% |
| U.S. Virgin Islanders | 12.1 /100 | #217 | Poor 27.1% |
| Greeks | 11.4 /100 | #218 | Poor 27.1% |
| Immigrants | Japan | 10.7 /100 | #219 | Poor 27.1% |
| Austrians | 9.9 /100 | #220 | Tragic 27.1% |
| New Zealanders | 9.6 /100 | #221 | Tragic 27.1% |
| Paraguayans | 9.4 /100 | #222 | Tragic 27.1% |
| Pima | 9.2 /100 | #223 | Tragic 27.1% |
| Germans | 8.7 /100 | #224 | Tragic 27.1% |
| Canadians | 7.5 /100 | #225 | Tragic 27.1% |