Iranian vs Ghanaian Single Mother Households
COMPARE
Iranian
Ghanaian
Single Mother Households
Single Mother Households Comparison
Iranians
Ghanaians
5.0%
SINGLE MOTHER HOUSEHOLDS
100.0/ 100
METRIC RATING
7th/ 347
METRIC RANK
7.8%
SINGLE MOTHER HOUSEHOLDS
0.0/ 100
METRIC RATING
292nd/ 347
METRIC RANK
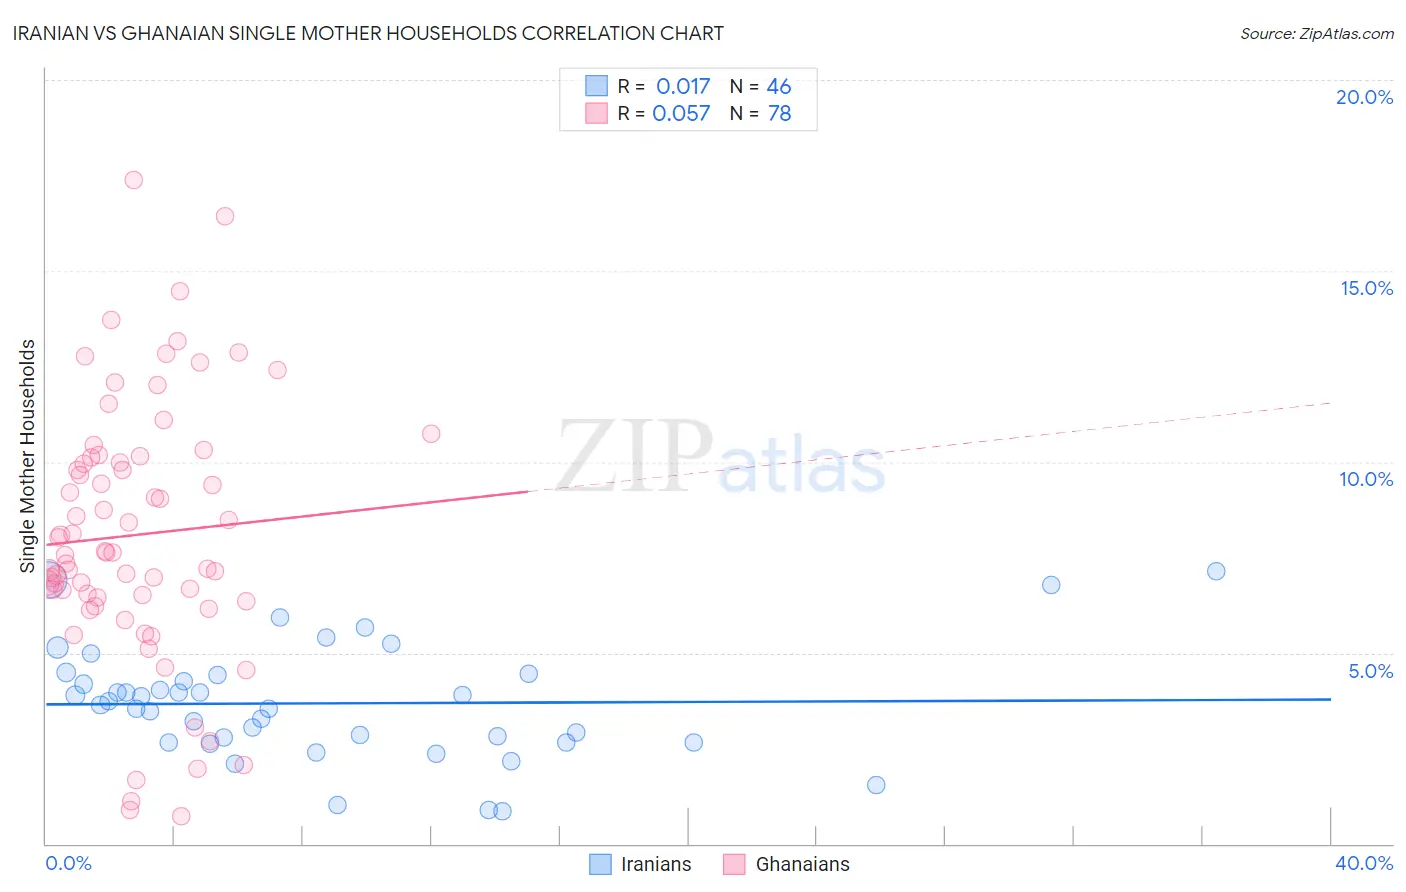
Iranian vs Ghanaian Single Mother Households Correlation Chart
The statistical analysis conducted on geographies consisting of 316,158,075 people shows no correlation between the proportion of Iranians and percentage of single mother households in the United States with a correlation coefficient (R) of 0.017 and weighted average of 5.0%. Similarly, the statistical analysis conducted on geographies consisting of 190,389,453 people shows a slight positive correlation between the proportion of Ghanaians and percentage of single mother households in the United States with a correlation coefficient (R) of 0.057 and weighted average of 7.8%, a difference of 57.8%.
Single Mother Households Correlation Summary
| Measurement | Iranian | Ghanaian |
| Minimum | 0.85% | 0.73% |
| Maximum | 7.1% | 17.4% |
| Range | 6.3% | 16.6% |
| Mean | 3.7% | 8.1% |
| Median | 3.7% | 7.6% |
| Interquartile 25% (IQ1) | 2.7% | 6.4% |
| Interquartile 75% (IQ3) | 4.4% | 10.1% |
| Interquartile Range (IQR) | 1.8% | 3.7% |
| Standard Deviation (Sample) | 1.5% | 3.4% |
| Standard Deviation (Population) | 1.5% | 3.4% |
Similar Demographics by Single Mother Households
Demographics Similar to Iranians by Single Mother Households
In terms of single mother households, the demographic groups most similar to Iranians are Immigrants from Singapore (5.0%, a difference of 0.25%), Immigrants from Ireland (5.0%, a difference of 0.66%), Okinawan (5.0%, a difference of 0.81%), Immigrants from Israel (5.0%, a difference of 1.1%), and Immigrants from China (5.1%, a difference of 1.8%).
| Demographics | Rating | Rank | Single Mother Households |
| Immigrants | Taiwan | 100.0 /100 | #1 | Exceptional 4.7% |
| Filipinos | 100.0 /100 | #2 | Exceptional 4.7% |
| Immigrants | Iran | 100.0 /100 | #3 | Exceptional 4.8% |
| Assyrians/Chaldeans/Syriacs | 100.0 /100 | #4 | Exceptional 4.8% |
| Immigrants | Hong Kong | 100.0 /100 | #5 | Exceptional 4.8% |
| Immigrants | Singapore | 100.0 /100 | #6 | Exceptional 5.0% |
| Iranians | 100.0 /100 | #7 | Exceptional 5.0% |
| Immigrants | Ireland | 99.9 /100 | #8 | Exceptional 5.0% |
| Okinawans | 99.9 /100 | #9 | Exceptional 5.0% |
| Immigrants | Israel | 99.9 /100 | #10 | Exceptional 5.0% |
| Immigrants | China | 99.9 /100 | #11 | Exceptional 5.1% |
| Cypriots | 99.9 /100 | #12 | Exceptional 5.1% |
| Immigrants | India | 99.9 /100 | #13 | Exceptional 5.1% |
| Immigrants | Australia | 99.9 /100 | #14 | Exceptional 5.1% |
| Immigrants | Eastern Asia | 99.9 /100 | #15 | Exceptional 5.1% |
Demographics Similar to Ghanaians by Single Mother Households
In terms of single mother households, the demographic groups most similar to Ghanaians are West Indian (7.8%, a difference of 0.010%), Immigrants from Nigeria (7.8%, a difference of 0.090%), Immigrants from Cameroon (7.9%, a difference of 0.36%), Apache (7.9%, a difference of 0.46%), and Subsaharan African (7.8%, a difference of 0.51%).
| Demographics | Rating | Rank | Single Mother Households |
| Trinidadians and Tobagonians | 0.0 /100 | #285 | Tragic 7.7% |
| Immigrants | Middle Africa | 0.0 /100 | #286 | Tragic 7.7% |
| Immigrants | Guatemala | 0.0 /100 | #287 | Tragic 7.7% |
| Sierra Leoneans | 0.0 /100 | #288 | Tragic 7.7% |
| Sub-Saharan Africans | 0.0 /100 | #289 | Tragic 7.8% |
| Immigrants | Nigeria | 0.0 /100 | #290 | Tragic 7.8% |
| West Indians | 0.0 /100 | #291 | Tragic 7.8% |
| Ghanaians | 0.0 /100 | #292 | Tragic 7.8% |
| Immigrants | Cameroon | 0.0 /100 | #293 | Tragic 7.9% |
| Apache | 0.0 /100 | #294 | Tragic 7.9% |
| Barbadians | 0.0 /100 | #295 | Tragic 7.9% |
| Immigrants | Latin America | 0.0 /100 | #296 | Tragic 7.9% |
| Hispanics or Latinos | 0.0 /100 | #297 | Tragic 7.9% |
| Immigrants | West Indies | 0.0 /100 | #298 | Tragic 7.9% |
| Houma | 0.0 /100 | #299 | Tragic 7.9% |