Immigrants from Western Europe vs Immigrants from Saudi Arabia Single Mother Households

COMPARE

Immigrants from Western Europe
Race
Ancestry
AfghanAfricanAlaska NativeAlaskan AthabascanAlbanianAleutAlsatianAmericanApacheArabArapahoArgentineanArmenianAssyrian/Chaldean/SyriacAustralianAustrianBahamianBangladeshiBarbadianBasqueBelgianBelizeanBermudanBhutaneseBlackfeetBolivianBrazilianBritishBritish West IndianBulgarianBurmeseCajunCambodianCanadianCape VerdeanCarpatho RusynCelticCentral AmericanCentral American IndianCherokeeCheyenneChickasawChileanChineseChippewaChoctawColombianColvilleComancheCosta RicanCreeCreekCroatianCrowCubanCypriotCzechCzechoslovakianDanishDelawareDominicanDutchDutch West IndianEastern EuropeanEcuadorianEgyptianEnglishEstonianEthiopianEuropeanFijianFilipinoFinnishFrenchFrench American IndianFrench CanadianGermanGerman RussianGhanaianGreekGuamanian/ChamorroGuatemalanGuyaneseHaitianHmongHonduranHopiHoumaHungarianIcelanderIndian (Asian)IndonesianInupiatIranianIraqiIrishIroquoisIsraeliItalianJamaicanJapaneseJordanianKenyanKiowaKoreanLaotianLatvianLebaneseLiberianLithuanianLumbeeLuxembourgerMacedonianMalaysianMalteseMarshalleseMenomineeMexicanMexican American IndianMongolianMoroccanNative HawaiianNavajoNepaleseNew ZealanderNicaraguanNigerianNorthern EuropeanNorwegianOkinawanOsageOttawaPaiutePakistaniPalestinianPanamanianParaguayanPennsylvania GermanPeruvianPimaPolishPortuguesePotawatomiPuebloPuerto RicanPuget Sound SalishRomanianRussianSalvadoranSamoanScandinavianScotch-IrishScottishSeminoleSenegaleseSerbianShoshoneSierra LeoneanSiouxSlavicSlovakSloveneSomaliSouth AfricanSouth AmericanSouth American IndianSoviet UnionSpaniardSpanishSpanish AmericanSpanish American IndianSri LankanSubsaharan AfricanSudaneseSwedishSwissSyrianTaiwaneseThaiTlingit-HaidaTohono O'OdhamTonganTrinidadian and TobagonianTsimshianTurkishU.S. Virgin IslanderUgandanUkrainianUruguayanUteVenezuelanVietnameseWelshWest IndianYakamaYaquiYugoslavianYumanYup'ikZimbabwean
Immigration
NonimmigrantsImmigrantsAfghanistanAfricaAlbaniaArgentinaArmeniaAsiaAustraliaAustriaBahamasBangladeshBarbadosBelarusBelgiumBelizeBoliviaBosnia and HerzegovinaBrazilBulgariaBurma/MyanmarCabo VerdeCambodiaCameroonCanadaCaribbeanCentral AmericaChileChinaColombiaCongoCosta RicaCroatiaCubaCzechoslovakiaDenmarkDominicaDominican RepublicEastern AfricaEastern AsiaEastern EuropeEcuadorEgyptEl SalvadorEnglandEritreaEthiopiaEuropeFijiFranceGermanyGhanaGreeceGrenadaGuatemalaGuyanaHaitiHondurasHong KongHungaryIndiaIndonesiaIranIraqIrelandIsraelItalyJamaicaJapanJordanKazakhstanKenyaKoreaKuwaitLaosLatin AmericaLatviaLebanonLiberiaLithuaniaMalaysiaMexicoMicronesiaMiddle AfricaMoldovaMoroccoNepalNetherlandsNicaraguaNigeriaNorth AmericaNorth MacedoniaNorthern AfricaNorthern EuropeNorwayOceaniaPakistanPanamaPeruPhilippinesPolandPortugalRomaniaRussiaScotlandSenegalSerbiaSierra LeoneSingaporeSomaliaSouth AfricaSouth AmericaSouth Central AsiaSouth Eastern AsiaSouthern EuropeSpainSri LankaSt. Vincent and the GrenadinesSudanSwedenSwitzerlandSyriaTaiwanThailandTrinidad and TobagoTurkeyUgandaUkraineUruguayUzbekistanVenezuelaVietnamWest IndiesWestern AfricaWestern AsiaWestern EuropeYemenZaireZimbabweAzores
Immigrants from Saudi Arabia
Race
Ancestry
AfghanAfricanAlaska NativeAlaskan AthabascanAlbanianAleutAlsatianAmericanApacheArabArapahoArgentineanArmenianAssyrian/Chaldean/SyriacAustralianAustrianBahamianBangladeshiBarbadianBasqueBelgianBelizeanBermudanBhutaneseBlackfeetBolivianBrazilianBritishBritish West IndianBulgarianBurmeseCajunCambodianCanadianCape VerdeanCarpatho RusynCelticCentral AmericanCentral American IndianCherokeeCheyenneChickasawChileanChineseChippewaChoctawColombianColvilleComancheCosta RicanCreeCreekCroatianCrowCubanCypriotCzechCzechoslovakianDanishDelawareDominicanDutchDutch West IndianEastern EuropeanEcuadorianEgyptianEnglishEstonianEthiopianEuropeanFijianFilipinoFinnishFrenchFrench American IndianFrench CanadianGermanGerman RussianGhanaianGreekGuamanian/ChamorroGuatemalanGuyaneseHaitianHmongHonduranHopiHoumaHungarianIcelanderIndian (Asian)IndonesianInupiatIranianIraqiIrishIroquoisIsraeliItalianJamaicanJapaneseJordanianKenyanKiowaKoreanLaotianLatvianLebaneseLiberianLithuanianLumbeeLuxembourgerMacedonianMalaysianMalteseMarshalleseMenomineeMexicanMexican American IndianMongolianMoroccanNative HawaiianNavajoNepaleseNew ZealanderNicaraguanNigerianNorthern EuropeanNorwegianOkinawanOsageOttawaPaiutePakistaniPalestinianPanamanianParaguayanPennsylvania GermanPeruvianPimaPolishPortuguesePotawatomiPuebloPuerto RicanPuget Sound SalishRomanianRussianSalvadoranSamoanScandinavianScotch-IrishScottishSeminoleSenegaleseSerbianShoshoneSierra LeoneanSiouxSlavicSlovakSloveneSomaliSouth AfricanSouth AmericanSouth American IndianSoviet UnionSpaniardSpanishSpanish AmericanSpanish American IndianSri LankanSubsaharan AfricanSudaneseSwedishSwissSyrianTaiwaneseThaiTlingit-HaidaTohono O'OdhamTonganTrinidadian and TobagonianTsimshianTurkishU.S. Virgin IslanderUgandanUkrainianUruguayanUteVenezuelanVietnameseWelshWest IndianYakamaYaquiYugoslavianYumanYup'ikZimbabwean
Immigration
NonimmigrantsImmigrantsAfghanistanAfricaAlbaniaArgentinaArmeniaAsiaAustraliaAustriaBahamasBangladeshBarbadosBelarusBelgiumBelizeBoliviaBosnia and HerzegovinaBrazilBulgariaBurma/MyanmarCabo VerdeCambodiaCameroonCanadaCaribbeanCentral AmericaChileChinaColombiaCongoCosta RicaCroatiaCubaCzechoslovakiaDenmarkDominicaDominican RepublicEastern AfricaEastern AsiaEastern EuropeEcuadorEgyptEl SalvadorEnglandEritreaEthiopiaEuropeFijiFranceGermanyGhanaGreeceGrenadaGuatemalaGuyanaHaitiHondurasHong KongHungaryIndiaIndonesiaIranIraqIrelandIsraelItalyJamaicaJapanJordanKazakhstanKenyaKoreaKuwaitLaosLatin AmericaLatviaLebanonLiberiaLithuaniaMalaysiaMexicoMicronesiaMiddle AfricaMoldovaMoroccoNepalNetherlandsNicaraguaNigeriaNorth AmericaNorth MacedoniaNorthern AfricaNorthern EuropeNorwayOceaniaPakistanPanamaPeruPhilippinesPolandPortugalRomaniaRussiaSaudi ArabiaScotlandSenegalSerbiaSierra LeoneSingaporeSomaliaSouth AfricaSouth AmericaSouth Central AsiaSouth Eastern AsiaSouthern EuropeSpainSri LankaSt. Vincent and the GrenadinesSudanSwedenSwitzerlandSyriaTaiwanThailandTrinidad and TobagoTurkeyUgandaUkraineUruguayUzbekistanVenezuelaVietnamWest IndiesWestern AfricaWestern AsiaYemenZaireZimbabweAzores
Single Mother Households
Income
Poverty
Unemployment
Labor Participation
Family Structure
Vehicle Availability
Education Level
Disability

Single Mother Households Comparison

Immigrants from Western Europe

Immigrants from Saudi Arabia

Exceptional
Exceptional
5.8%
SINGLE MOTHER HOUSEHOLDS
95.7/ 100
METRIC RATING
109th/ 347
METRIC RANK
5.9%
SINGLE MOTHER HOUSEHOLDS
90.2/ 100
METRIC RATING
135th/ 347
METRIC RANK

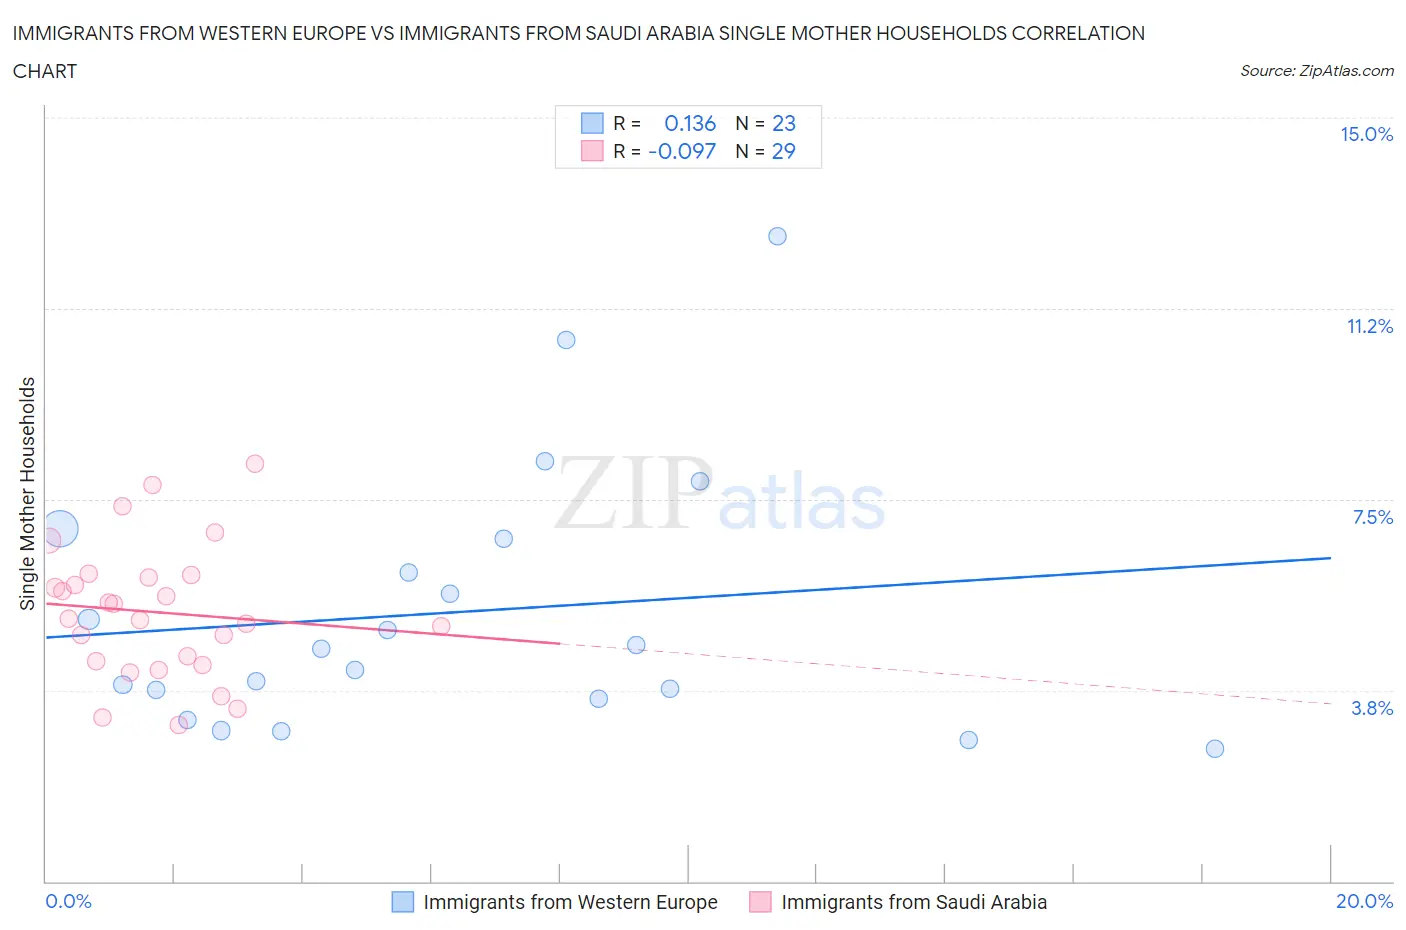
Immigrants from Western Europe vs Immigrants from Saudi Arabia Single Mother Households Correlation Chart

The statistical analysis conducted on geographies consisting of 491,703,619 people shows a poor positive correlation between the proportion of Immigrants from Western Europe and percentage of single mother households in the United States with a correlation coefficient (R) of 0.136 and weighted average of 5.8%. Similarly, the statistical analysis conducted on geographies consisting of 164,140,897 people shows a slight negative correlation between the proportion of Immigrants from Saudi Arabia and percentage of single mother households in the United States with a correlation coefficient (R) of -0.097 and weighted average of 5.9%, a difference of 2.6%.
Immigrants from Western Europe vs Immigrants from Saudi Arabia Single Mother Households

Single Mother Households Correlation Summary

MeasurementImmigrants from Western EuropeImmigrants from Saudi Arabia
Minimum2.6%3.1%
Maximum12.7%8.2%
Range10.1%5.1%
Mean5.3%5.3%
Median4.6%5.1%
Interquartile 25% (IQ1)3.6%4.3%
Interquartile 75% (IQ3)6.7%6.0%
Interquartile Range (IQR)3.2%1.7%
Standard Deviation (Sample)2.6%1.3%
Standard Deviation (Population)2.5%1.3%

Similar Demographics by Single Mother Households

Demographics Similar to Immigrants from Western Europe by Single Mother Households

In terms of single mother households, the demographic groups most similar to Immigrants from Western Europe are Paraguayan (5.8%, a difference of 0.090%), Immigrants from Italy (5.8%, a difference of 0.090%), British (5.8%, a difference of 0.090%), Immigrants from England (5.8%, a difference of 0.12%), and Immigrants from Kuwait (5.8%, a difference of 0.16%).
DemographicsRating | RankSingle Mother Households
English
96.2
/100
|
#102
Exceptional
5.8%
Scottish
96.2
/100
|
#103
Exceptional
5.8%
Northern Europeans
96.2
/100
|
#104
Exceptional
5.8%
Taiwanese
96.1
/100
|
#105
Exceptional
5.8%
Immigrants | Ukraine
95.9
/100
|
#106
Exceptional
5.8%
Paraguayans
95.8
/100
|
#107
Exceptional
5.8%
Immigrants | Italy
95.8
/100
|
#108
Exceptional
5.8%
Immigrants | Western Europe
95.7
/100
|
#109
Exceptional
5.8%
British
95.5
/100
|
#110
Exceptional
5.8%
Immigrants | England
95.5
/100
|
#111
Exceptional
5.8%
Immigrants | Kuwait
95.4
/100
|
#112
Exceptional
5.8%
Mongolians
95.3
/100
|
#113
Exceptional
5.8%
Dutch
95.1
/100
|
#114
Exceptional
5.8%
Irish
94.8
/100
|
#115
Exceptional
5.8%
Pennsylvania Germans
94.7
/100
|
#116
Exceptional
5.8%

Demographics Similar to Immigrants from Saudi Arabia by Single Mother Households

In terms of single mother households, the demographic groups most similar to Immigrants from Saudi Arabia are Canadian (5.9%, a difference of 0.090%), Egyptian (5.9%, a difference of 0.15%), Albanian (5.9%, a difference of 0.31%), Immigrants from Spain (5.9%, a difference of 0.35%), and Jordanian (6.0%, a difference of 0.42%).
DemographicsRating | RankSingle Mother Households
Czechoslovakians
92.2
/100
|
#128
Exceptional
5.9%
Immigrants | Bolivia
92.2
/100
|
#129
Exceptional
5.9%
Palestinians
92.1
/100
|
#130
Exceptional
5.9%
Immigrants | Spain
91.2
/100
|
#131
Exceptional
5.9%
Albanians
91.1
/100
|
#132
Exceptional
5.9%
Egyptians
90.7
/100
|
#133
Exceptional
5.9%
Canadians
90.5
/100
|
#134
Exceptional
5.9%
Immigrants | Saudi Arabia
90.2
/100
|
#135
Exceptional
5.9%
Jordanians
88.9
/100
|
#136
Excellent
6.0%
Immigrants | Pakistan
88.4
/100
|
#137
Excellent
6.0%
Icelanders
86.9
/100
|
#138
Excellent
6.0%
Syrians
86.0
/100
|
#139
Excellent
6.0%
French
85.7
/100
|
#140
Excellent
6.0%
Tsimshian
85.2
/100
|
#141
Excellent
6.0%
Immigrants | Egypt
85.0
/100
|
#142
Excellent
6.0%