Immigrants from North Macedonia vs Immigrants from Saudi Arabia Single Mother Households
COMPARE
Immigrants from North Macedonia
Immigrants from Saudi Arabia
Single Mother Households
Single Mother Households Comparison
Immigrants from North Macedonia
Immigrants from Saudi Arabia
5.6%
SINGLE MOTHER HOUSEHOLDS
98.6/ 100
METRIC RATING
63rd/ 347
METRIC RANK
5.9%
SINGLE MOTHER HOUSEHOLDS
90.2/ 100
METRIC RATING
135th/ 347
METRIC RANK
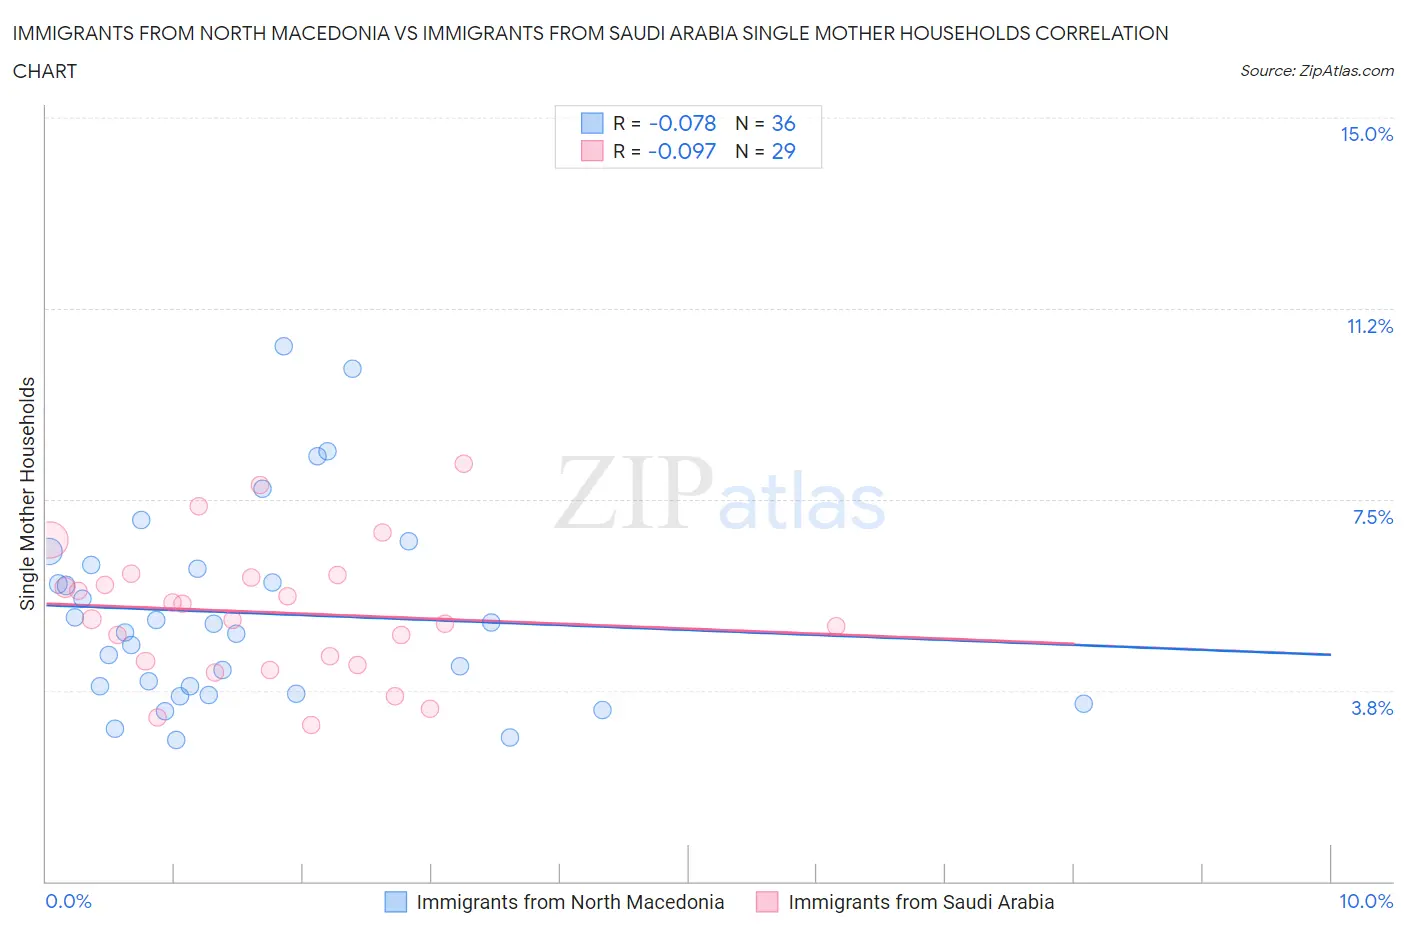
Immigrants from North Macedonia vs Immigrants from Saudi Arabia Single Mother Households Correlation Chart
The statistical analysis conducted on geographies consisting of 74,285,342 people shows a slight negative correlation between the proportion of Immigrants from North Macedonia and percentage of single mother households in the United States with a correlation coefficient (R) of -0.078 and weighted average of 5.6%. Similarly, the statistical analysis conducted on geographies consisting of 164,140,897 people shows a slight negative correlation between the proportion of Immigrants from Saudi Arabia and percentage of single mother households in the United States with a correlation coefficient (R) of -0.097 and weighted average of 5.9%, a difference of 6.3%.
Single Mother Households Correlation Summary
| Measurement | Immigrants from North Macedonia | Immigrants from Saudi Arabia |
| Minimum | 2.8% | 3.1% |
| Maximum | 10.5% | 8.2% |
| Range | 7.7% | 5.1% |
| Mean | 5.3% | 5.3% |
| Median | 5.0% | 5.1% |
| Interquartile 25% (IQ1) | 3.8% | 4.3% |
| Interquartile 75% (IQ3) | 6.2% | 6.0% |
| Interquartile Range (IQR) | 2.4% | 1.7% |
| Standard Deviation (Sample) | 1.9% | 1.3% |
| Standard Deviation (Population) | 1.9% | 1.3% |
Similar Demographics by Single Mother Households
Demographics Similar to Immigrants from North Macedonia by Single Mother Households
In terms of single mother households, the demographic groups most similar to Immigrants from North Macedonia are Immigrants from France (5.6%, a difference of 0.040%), Polish (5.6%, a difference of 0.070%), Australian (5.6%, a difference of 0.080%), Greek (5.6%, a difference of 0.080%), and Immigrants from Norway (5.6%, a difference of 0.15%).
| Demographics | Rating | Rank | Single Mother Households |
| Immigrants | Romania | 99.0 /100 | #56 | Exceptional 5.5% |
| Immigrants | Europe | 99.0 /100 | #57 | Exceptional 5.5% |
| Danes | 98.9 /100 | #58 | Exceptional 5.5% |
| Luxembourgers | 98.7 /100 | #59 | Exceptional 5.6% |
| Immigrants | Norway | 98.7 /100 | #60 | Exceptional 5.6% |
| Australians | 98.7 /100 | #61 | Exceptional 5.6% |
| Poles | 98.6 /100 | #62 | Exceptional 5.6% |
| Immigrants | North Macedonia | 98.6 /100 | #63 | Exceptional 5.6% |
| Immigrants | France | 98.6 /100 | #64 | Exceptional 5.6% |
| Greeks | 98.6 /100 | #65 | Exceptional 5.6% |
| Immigrants | Canada | 98.5 /100 | #66 | Exceptional 5.6% |
| Italians | 98.5 /100 | #67 | Exceptional 5.6% |
| Immigrants | Bulgaria | 98.5 /100 | #68 | Exceptional 5.6% |
| Asians | 98.5 /100 | #69 | Exceptional 5.6% |
| Immigrants | Eastern Europe | 98.4 /100 | #70 | Exceptional 5.6% |
Demographics Similar to Immigrants from Saudi Arabia by Single Mother Households
In terms of single mother households, the demographic groups most similar to Immigrants from Saudi Arabia are Canadian (5.9%, a difference of 0.090%), Egyptian (5.9%, a difference of 0.15%), Albanian (5.9%, a difference of 0.31%), Immigrants from Spain (5.9%, a difference of 0.35%), and Jordanian (6.0%, a difference of 0.42%).
| Demographics | Rating | Rank | Single Mother Households |
| Czechoslovakians | 92.2 /100 | #128 | Exceptional 5.9% |
| Immigrants | Bolivia | 92.2 /100 | #129 | Exceptional 5.9% |
| Palestinians | 92.1 /100 | #130 | Exceptional 5.9% |
| Immigrants | Spain | 91.2 /100 | #131 | Exceptional 5.9% |
| Albanians | 91.1 /100 | #132 | Exceptional 5.9% |
| Egyptians | 90.7 /100 | #133 | Exceptional 5.9% |
| Canadians | 90.5 /100 | #134 | Exceptional 5.9% |
| Immigrants | Saudi Arabia | 90.2 /100 | #135 | Exceptional 5.9% |
| Jordanians | 88.9 /100 | #136 | Excellent 6.0% |
| Immigrants | Pakistan | 88.4 /100 | #137 | Excellent 6.0% |
| Icelanders | 86.9 /100 | #138 | Excellent 6.0% |
| Syrians | 86.0 /100 | #139 | Excellent 6.0% |
| French | 85.7 /100 | #140 | Excellent 6.0% |
| Tsimshian | 85.2 /100 | #141 | Excellent 6.0% |
| Immigrants | Egypt | 85.0 /100 | #142 | Excellent 6.0% |