Immigrants from Turkey vs Ethiopian Family Households with Children

COMPARE

Immigrants from Turkey
Race
Ancestry
AfghanAfricanAlaska NativeAlaskan AthabascanAlbanianAleutAlsatianAmericanApacheArabArapahoArgentineanArmenianAssyrian/Chaldean/SyriacAustralianAustrianBahamianBangladeshiBarbadianBasqueBelgianBelizeanBermudanBhutaneseBlackfeetBolivianBrazilianBritishBritish West IndianBulgarianBurmeseCajunCambodianCanadianCape VerdeanCarpatho RusynCelticCentral AmericanCentral American IndianCherokeeCheyenneChickasawChileanChineseChippewaChoctawColombianColvilleComancheCosta RicanCreeCreekCroatianCrowCubanCypriotCzechCzechoslovakianDanishDelawareDominicanDutchDutch West IndianEastern EuropeanEcuadorianEgyptianEnglishEstonianEuropeanFijianFilipinoFinnishFrenchFrench American IndianFrench CanadianGermanGerman RussianGhanaianGreekGuamanian/ChamorroGuatemalanGuyaneseHaitianHmongHonduranHopiHoumaHungarianIcelanderIndian (Asian)IndonesianInupiatIranianIraqiIrishIroquoisIsraeliItalianJamaicanJapaneseJordanianKenyanKiowaKoreanLaotianLatvianLebaneseLiberianLithuanianLumbeeLuxembourgerMacedonianMalaysianMalteseMarshalleseMenomineeMexicanMexican American IndianMongolianMoroccanNative HawaiianNavajoNepaleseNew ZealanderNicaraguanNigerianNorthern EuropeanNorwegianOkinawanOsageOttawaPaiutePakistaniPalestinianPanamanianParaguayanPennsylvania GermanPeruvianPimaPolishPortuguesePotawatomiPuebloPuerto RicanPuget Sound SalishRomanianRussianSalvadoranSamoanScandinavianScotch-IrishScottishSeminoleSenegaleseSerbianShoshoneSierra LeoneanSiouxSlavicSlovakSloveneSomaliSouth AfricanSouth AmericanSouth American IndianSoviet UnionSpaniardSpanishSpanish AmericanSpanish American IndianSri LankanSubsaharan AfricanSudaneseSwedishSwissSyrianTaiwaneseThaiTlingit-HaidaTohono O'OdhamTonganTrinidadian and TobagonianTsimshianTurkishU.S. Virgin IslanderUgandanUkrainianUruguayanUteVenezuelanVietnameseWelshWest IndianYakamaYaquiYugoslavianYumanYup'ikZimbabwean
Immigration
NonimmigrantsImmigrantsAfghanistanAfricaAlbaniaArgentinaArmeniaAsiaAustraliaAustriaBahamasBangladeshBarbadosBelarusBelgiumBelizeBoliviaBosnia and HerzegovinaBrazilBulgariaBurma/MyanmarCabo VerdeCambodiaCameroonCanadaCaribbeanCentral AmericaChileChinaColombiaCongoCosta RicaCroatiaCubaCzechoslovakiaDenmarkDominicaDominican RepublicEastern AfricaEastern AsiaEastern EuropeEcuadorEgyptEl SalvadorEnglandEritreaEthiopiaEuropeFijiFranceGermanyGhanaGreeceGrenadaGuatemalaGuyanaHaitiHondurasHong KongHungaryIndiaIndonesiaIranIraqIrelandIsraelItalyJamaicaJapanJordanKazakhstanKenyaKoreaKuwaitLaosLatin AmericaLatviaLebanonLiberiaLithuaniaMalaysiaMexicoMicronesiaMiddle AfricaMoldovaMoroccoNepalNetherlandsNicaraguaNigeriaNorth AmericaNorth MacedoniaNorthern AfricaNorthern EuropeNorwayOceaniaPakistanPanamaPeruPhilippinesPolandPortugalRomaniaRussiaSaudi ArabiaScotlandSenegalSerbiaSierra LeoneSingaporeSomaliaSouth AfricaSouth AmericaSouth Central AsiaSouth Eastern AsiaSouthern EuropeSpainSri LankaSt. Vincent and the GrenadinesSudanSwedenSwitzerlandSyriaTaiwanThailandTrinidad and TobagoTurkeyUgandaUkraineUruguayUzbekistanVenezuelaVietnamWest IndiesWestern AfricaWestern AsiaWestern EuropeYemenZaireZimbabweAzores
Ethiopian
Race
Ancestry
AfghanAfricanAlaska NativeAlaskan AthabascanAlbanianAleutAlsatianAmericanApacheArabArapahoArgentineanArmenianAssyrian/Chaldean/SyriacAustralianAustrianBahamianBangladeshiBarbadianBasqueBelgianBelizeanBermudanBhutaneseBlackfeetBolivianBrazilianBritishBritish West IndianBulgarianBurmeseCajunCambodianCanadianCape VerdeanCarpatho RusynCelticCentral AmericanCentral American IndianCherokeeCheyenneChickasawChileanChineseChippewaChoctawColombianColvilleComancheCosta RicanCreeCreekCroatianCrowCubanCypriotCzechCzechoslovakianDanishDelawareDominicanDutchDutch West IndianEastern EuropeanEcuadorianEgyptianEnglishEstonianEthiopianEuropeanFijianFilipinoFinnishFrenchFrench American IndianFrench CanadianGermanGerman RussianGhanaianGreekGuamanian/ChamorroGuatemalanGuyaneseHaitianHmongHonduranHopiHoumaHungarianIcelanderIndian (Asian)IndonesianInupiatIranianIraqiIrishIroquoisIsraeliItalianJamaicanJapaneseJordanianKenyanKiowaKoreanLaotianLatvianLebaneseLiberianLithuanianLumbeeLuxembourgerMacedonianMalaysianMalteseMarshalleseMenomineeMexicanMexican American IndianMongolianMoroccanNative HawaiianNavajoNepaleseNew ZealanderNicaraguanNigerianNorthern EuropeanNorwegianOkinawanOsageOttawaPaiutePakistaniPalestinianPanamanianParaguayanPennsylvania GermanPeruvianPimaPolishPortuguesePotawatomiPuebloPuerto RicanPuget Sound SalishRomanianRussianSalvadoranSamoanScandinavianScotch-IrishScottishSeminoleSenegaleseSerbianShoshoneSierra LeoneanSiouxSlavicSlovakSloveneSomaliSouth AfricanSouth AmericanSouth American IndianSoviet UnionSpaniardSpanishSpanish AmericanSpanish American IndianSri LankanSubsaharan AfricanSudaneseSwedishSwissSyrianTaiwaneseThaiTlingit-HaidaTohono O'OdhamTonganTrinidadian and TobagonianTsimshianTurkishU.S. Virgin IslanderUgandanUkrainianUruguayanUteVenezuelanVietnameseWelshWest IndianYakamaYaquiYugoslavianYumanYup'ikZimbabwean
Immigration
NonimmigrantsImmigrantsAfghanistanAfricaAlbaniaArgentinaArmeniaAsiaAustraliaAustriaBahamasBangladeshBarbadosBelarusBelgiumBelizeBoliviaBosnia and HerzegovinaBrazilBulgariaBurma/MyanmarCabo VerdeCambodiaCameroonCanadaCaribbeanCentral AmericaChileChinaColombiaCongoCosta RicaCroatiaCubaCzechoslovakiaDenmarkDominicaDominican RepublicEastern AfricaEastern AsiaEastern EuropeEcuadorEgyptEl SalvadorEnglandEritreaEthiopiaEuropeFijiFranceGermanyGhanaGreeceGrenadaGuatemalaGuyanaHaitiHondurasHong KongHungaryIndiaIndonesiaIranIraqIrelandIsraelItalyJamaicaJapanJordanKazakhstanKenyaKoreaKuwaitLaosLatin AmericaLatviaLebanonLiberiaLithuaniaMalaysiaMexicoMicronesiaMiddle AfricaMoldovaMoroccoNepalNetherlandsNicaraguaNigeriaNorth AmericaNorth MacedoniaNorthern AfricaNorthern EuropeNorwayOceaniaPakistanPanamaPeruPhilippinesPolandPortugalRomaniaRussiaSaudi ArabiaScotlandSenegalSerbiaSierra LeoneSingaporeSomaliaSouth AfricaSouth AmericaSouth Central AsiaSouth Eastern AsiaSouthern EuropeSpainSri LankaSt. Vincent and the GrenadinesSudanSwedenSwitzerlandSyriaTaiwanThailandTrinidad and TobagoUgandaUkraineUruguayUzbekistanVenezuelaVietnamWest IndiesWestern AfricaWestern AsiaWestern EuropeYemenZaireZimbabweAzores
Family Households with Children
Income
Poverty
Unemployment
Labor Participation
Family Structure
Vehicle Availability
Education Level
Disability

Family Households with Children Comparison

Immigrants from Turkey

Ethiopians

Average
Good
27.4%
FAMILY HOUSEHOLDS WITH CHILDREN
46.9/ 100
METRIC RATING
180th/ 347
METRIC RANK
27.6%
FAMILY HOUSEHOLDS WITH CHILDREN
77.0/ 100
METRIC RATING
152nd/ 347
METRIC RANK

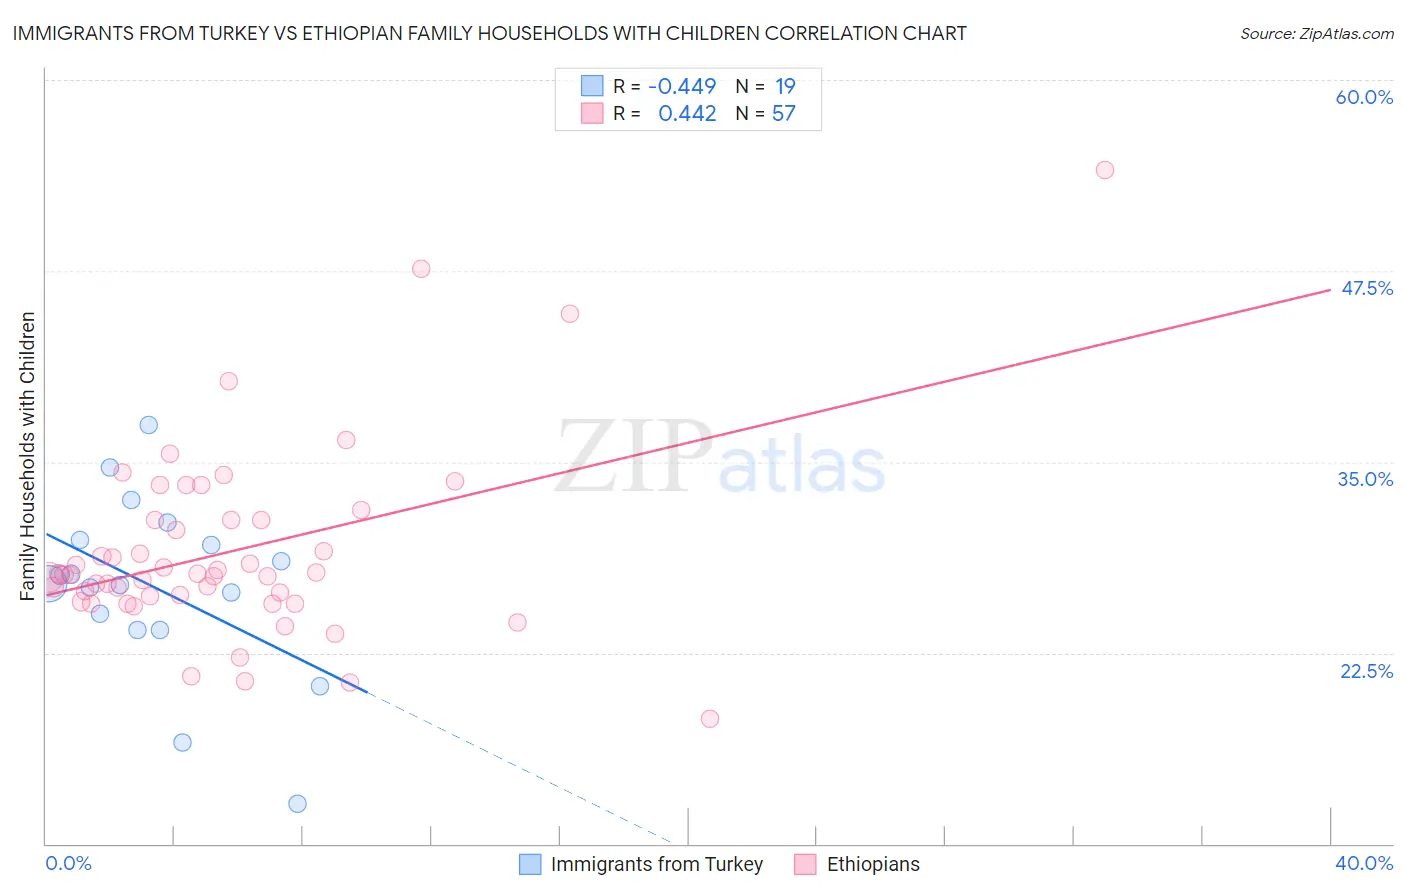
Immigrants from Turkey vs Ethiopian Family Households with Children Correlation Chart

The statistical analysis conducted on geographies consisting of 222,939,081 people shows a moderate negative correlation between the proportion of Immigrants from Turkey and percentage of family households with children in the United States with a correlation coefficient (R) of -0.449 and weighted average of 27.4%. Similarly, the statistical analysis conducted on geographies consisting of 223,037,255 people shows a moderate positive correlation between the proportion of Ethiopians and percentage of family households with children in the United States with a correlation coefficient (R) of 0.442 and weighted average of 27.6%, a difference of 0.73%.
Immigrants from Turkey vs Ethiopian Family Households with Children

Family Households with Children Correlation Summary

MeasurementImmigrants from TurkeyEthiopian
Minimum12.6%18.2%
Maximum37.5%54.1%
Range24.8%35.9%
Mean26.8%29.2%
Median27.0%27.6%
Interquartile 25% (IQ1)24.0%26.0%
Interquartile 75% (IQ3)29.9%31.2%
Interquartile Range (IQR)5.9%5.1%
Standard Deviation (Sample)5.8%6.2%
Standard Deviation (Population)5.7%6.2%

Similar Demographics by Family Households with Children

Demographics Similar to Immigrants from Turkey by Family Households with Children

In terms of family households with children, the demographic groups most similar to Immigrants from Turkey are Turkish (27.4%, a difference of 0.0%), Aleut (27.4%, a difference of 0.0%), Puget Sound Salish (27.4%, a difference of 0.010%), Spanish American (27.4%, a difference of 0.040%), and Ugandan (27.4%, a difference of 0.050%).
DemographicsRating | RankFamily Households with Children
Immigrants | Argentina
52.2
/100
|
#173
Average
27.5%
Whites/Caucasians
50.0
/100
|
#174
Average
27.4%
British
49.9
/100
|
#175
Average
27.4%
Immigrants | China
49.6
/100
|
#176
Average
27.4%
Ugandans
49.2
/100
|
#177
Average
27.4%
Spanish Americans
48.9
/100
|
#178
Average
27.4%
Turks
46.9
/100
|
#179
Average
27.4%
Immigrants | Turkey
46.9
/100
|
#180
Average
27.4%
Aleuts
46.7
/100
|
#181
Average
27.4%
Puget Sound Salish
46.2
/100
|
#182
Average
27.4%
South Africans
44.9
/100
|
#183
Average
27.4%
Native Hawaiians
44.6
/100
|
#184
Average
27.4%
Delaware
42.0
/100
|
#185
Average
27.4%
Immigrants | Brazil
40.6
/100
|
#186
Average
27.4%
Creek
39.8
/100
|
#187
Fair
27.4%

Demographics Similar to Ethiopians by Family Households with Children

In terms of family households with children, the demographic groups most similar to Ethiopians are Portuguese (27.6%, a difference of 0.030%), Immigrants from Cabo Verde (27.6%, a difference of 0.040%), Argentinean (27.6%, a difference of 0.050%), Icelander (27.6%, a difference of 0.050%), and Osage (27.6%, a difference of 0.060%).
DemographicsRating | RankFamily Households with Children
Immigrants | Chile
79.5
/100
|
#145
Good
27.7%
Basques
79.5
/100
|
#146
Good
27.7%
Immigrants | Moldova
79.1
/100
|
#147
Good
27.6%
Osage
79.0
/100
|
#148
Good
27.6%
Menominee
78.9
/100
|
#149
Good
27.6%
Argentineans
78.5
/100
|
#150
Good
27.6%
Portuguese
77.8
/100
|
#151
Good
27.6%
Ethiopians
77.0
/100
|
#152
Good
27.6%
Immigrants | Cabo Verde
75.6
/100
|
#153
Good
27.6%
Icelanders
75.3
/100
|
#154
Good
27.6%
Comanche
74.8
/100
|
#155
Good
27.6%
Hungarians
74.6
/100
|
#156
Good
27.6%
Indians (Asian)
71.6
/100
|
#157
Good
27.6%
Romanians
70.8
/100
|
#158
Good
27.6%
Mongolians
70.7
/100
|
#159
Good
27.6%