Immigrants from Northern Africa vs Romanian Births to Unmarried Women
COMPARE
Immigrants from Northern Africa
Romanian
Births to Unmarried Women
Births to Unmarried Women Comparison
Immigrants from Northern Africa
Romanians
29.5%
BIRTHS TO UNMARRIED WOMEN
94.7/ 100
METRIC RATING
101st/ 347
METRIC RANK
28.7%
BIRTHS TO UNMARRIED WOMEN
98.0/ 100
METRIC RATING
82nd/ 347
METRIC RANK
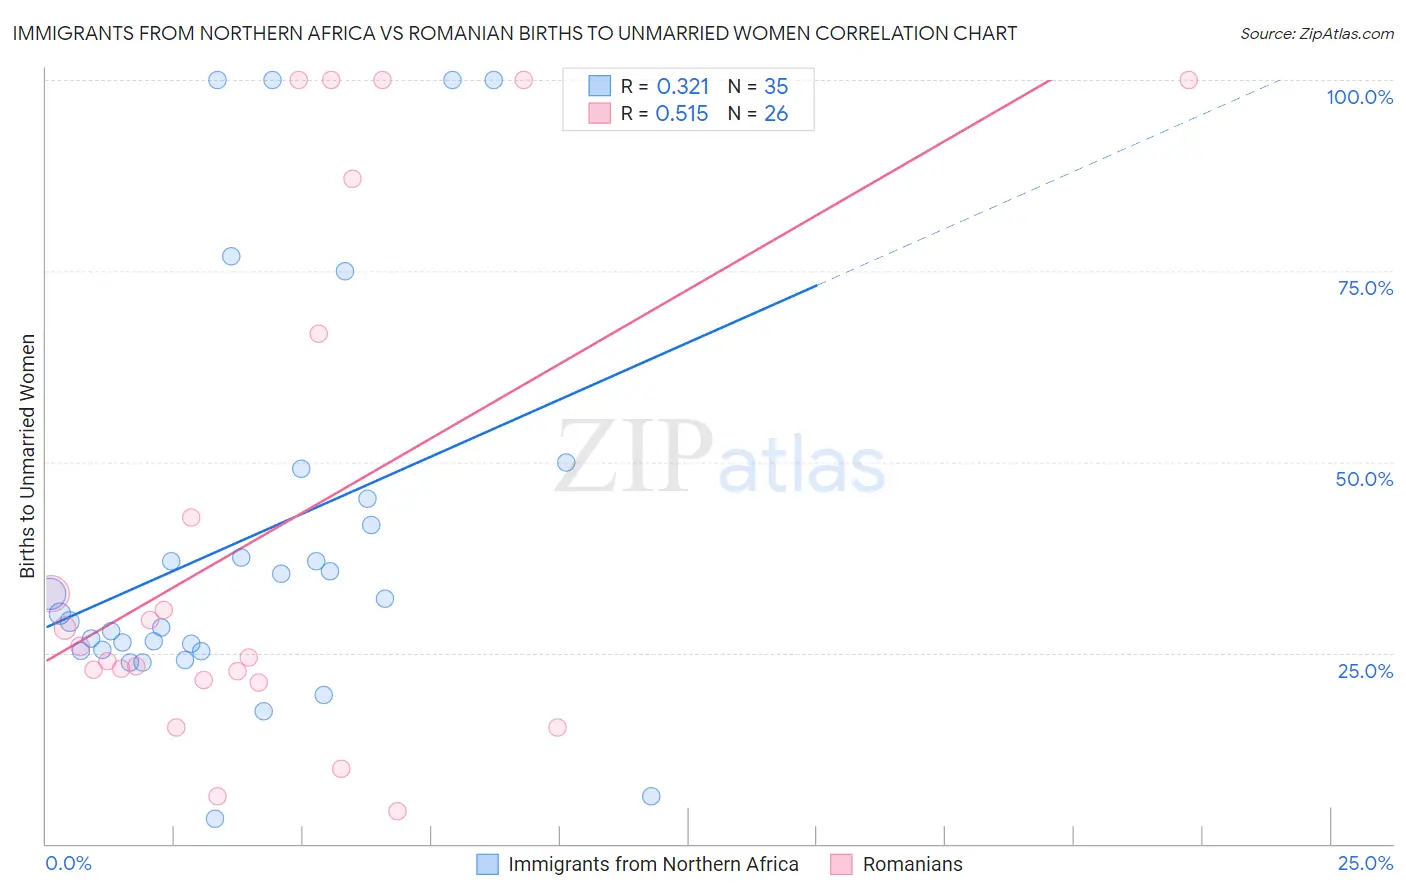
Immigrants from Northern Africa vs Romanian Births to Unmarried Women Correlation Chart
The statistical analysis conducted on geographies consisting of 302,719,907 people shows a mild positive correlation between the proportion of Immigrants from Northern Africa and percentage of births to unmarried women in the United States with a correlation coefficient (R) of 0.321 and weighted average of 29.5%. Similarly, the statistical analysis conducted on geographies consisting of 350,464,918 people shows a substantial positive correlation between the proportion of Romanians and percentage of births to unmarried women in the United States with a correlation coefficient (R) of 0.515 and weighted average of 28.7%, a difference of 2.7%.
Births to Unmarried Women Correlation Summary
| Measurement | Immigrants from Northern Africa | Romanian |
| Minimum | 3.2% | 4.3% |
| Maximum | 100.0% | 100.0% |
| Range | 96.8% | 95.7% |
| Mean | 40.0% | 41.4% |
| Median | 30.2% | 25.1% |
| Interquartile 25% (IQ1) | 25.3% | 21.4% |
| Interquartile 75% (IQ3) | 45.1% | 66.7% |
| Interquartile Range (IQR) | 19.8% | 45.3% |
| Standard Deviation (Sample) | 26.3% | 33.7% |
| Standard Deviation (Population) | 25.9% | 33.1% |
Demographics Similar to Immigrants from Northern Africa and Romanians by Births to Unmarried Women
In terms of births to unmarried women, the demographic groups most similar to Immigrants from Northern Africa are Immigrants from Denmark (29.4%, a difference of 0.29%), Luxembourger (29.4%, a difference of 0.29%), Immigrants from Syria (29.4%, a difference of 0.53%), Immigrants from South Africa (29.3%, a difference of 0.55%), and Norwegian (29.3%, a difference of 0.60%). Similarly, the demographic groups most similar to Romanians are Immigrants from Kuwait (28.8%, a difference of 0.080%), Immigrants from Austria (28.7%, a difference of 0.11%), Immigrants from Poland (28.9%, a difference of 0.50%), Sri Lankan (28.9%, a difference of 0.67%), and Immigrants from Jordan (29.0%, a difference of 0.74%).
| Demographics | Rating | Rank | Births to Unmarried Women |
| Immigrants | Austria | 98.1 /100 | #81 | Exceptional 28.7% |
| Romanians | 98.0 /100 | #82 | Exceptional 28.7% |
| Immigrants | Kuwait | 98.0 /100 | #83 | Exceptional 28.8% |
| Immigrants | Poland | 97.6 /100 | #84 | Exceptional 28.9% |
| Sri Lankans | 97.5 /100 | #85 | Exceptional 28.9% |
| Immigrants | Jordan | 97.4 /100 | #86 | Exceptional 29.0% |
| Taiwanese | 97.3 /100 | #87 | Exceptional 29.0% |
| Immigrants | France | 97.3 /100 | #88 | Exceptional 29.0% |
| Immigrants | Saudi Arabia | 97.0 /100 | #89 | Exceptional 29.1% |
| Immigrants | Latvia | 96.8 /100 | #90 | Exceptional 29.1% |
| Immigrants | Fiji | 96.6 /100 | #91 | Exceptional 29.2% |
| Arabs | 96.5 /100 | #92 | Exceptional 29.2% |
| Estonians | 96.5 /100 | #93 | Exceptional 29.2% |
| Ukrainians | 96.3 /100 | #94 | Exceptional 29.2% |
| Immigrants | Vietnam | 96.1 /100 | #95 | Exceptional 29.3% |
| Norwegians | 95.8 /100 | #96 | Exceptional 29.3% |
| Immigrants | South Africa | 95.7 /100 | #97 | Exceptional 29.3% |
| Immigrants | Syria | 95.7 /100 | #98 | Exceptional 29.4% |
| Immigrants | Denmark | 95.3 /100 | #99 | Exceptional 29.4% |
| Luxembourgers | 95.2 /100 | #100 | Exceptional 29.4% |
| Immigrants | Northern Africa | 94.7 /100 | #101 | Exceptional 29.5% |