Immigrants from Lithuania vs Hungarian Divorced or Separated
COMPARE
Immigrants from Lithuania
Hungarian
Divorced or Separated
Divorced or Separated Comparison
Immigrants from Lithuania
Hungarians
11.3%
DIVORCED OR SEPARATED
99.9/ 100
METRIC RATING
53rd/ 347
METRIC RANK
12.0%
DIVORCED OR SEPARATED
70.3/ 100
METRIC RATING
156th/ 347
METRIC RANK
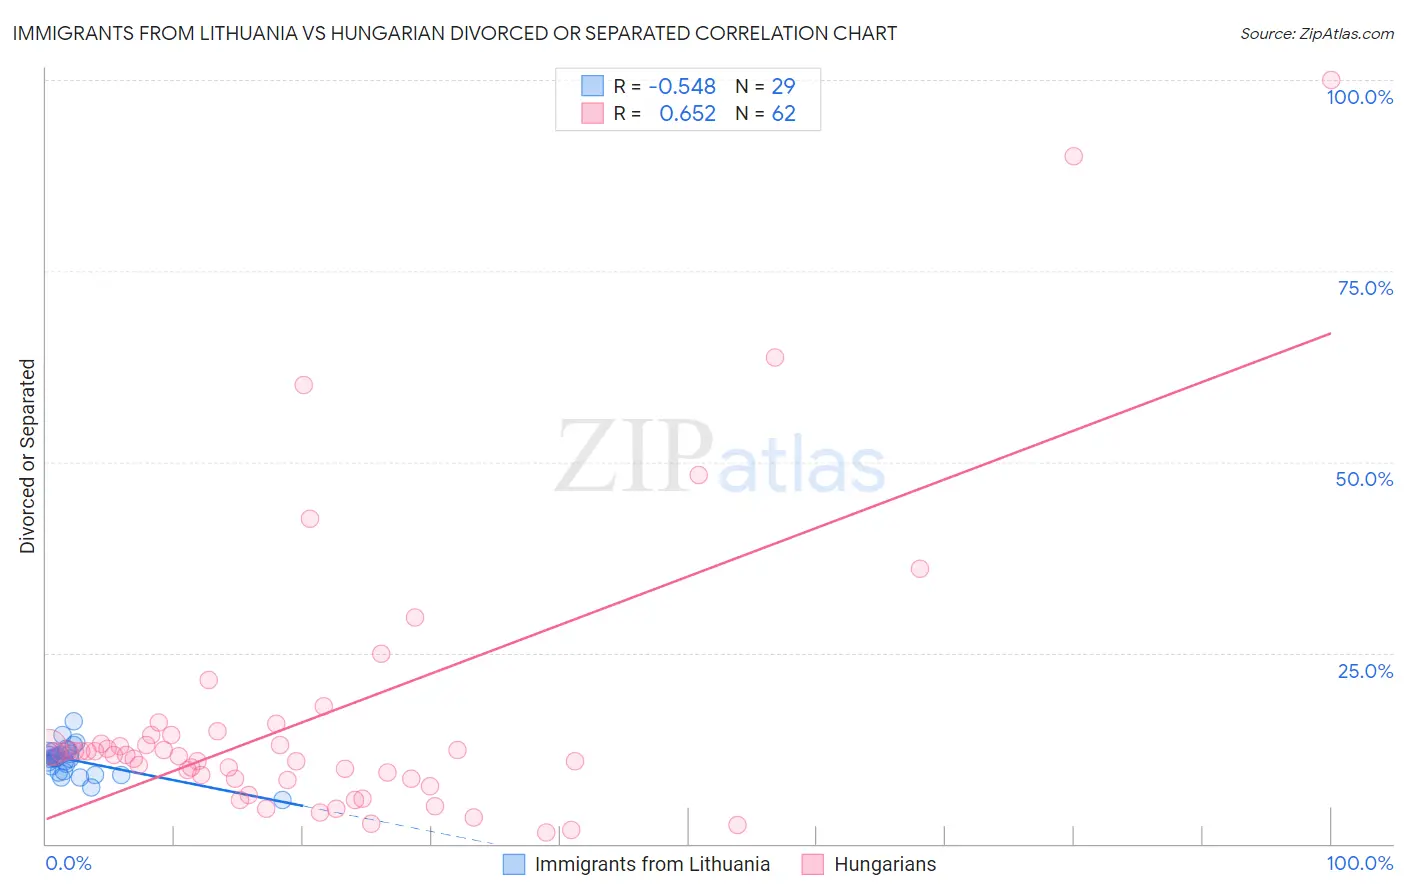
Immigrants from Lithuania vs Hungarian Divorced or Separated Correlation Chart
The statistical analysis conducted on geographies consisting of 117,722,237 people shows a substantial negative correlation between the proportion of Immigrants from Lithuania and percentage of population currently divorced or separated in the United States with a correlation coefficient (R) of -0.548 and weighted average of 11.3%. Similarly, the statistical analysis conducted on geographies consisting of 485,998,803 people shows a significant positive correlation between the proportion of Hungarians and percentage of population currently divorced or separated in the United States with a correlation coefficient (R) of 0.652 and weighted average of 12.0%, a difference of 6.0%.
Divorced or Separated Correlation Summary
| Measurement | Immigrants from Lithuania | Hungarian |
| Minimum | 5.7% | 1.4% |
| Maximum | 16.1% | 100.0% |
| Range | 10.4% | 98.6% |
| Mean | 10.9% | 16.6% |
| Median | 11.2% | 11.7% |
| Interquartile 25% (IQ1) | 9.5% | 8.5% |
| Interquartile 75% (IQ3) | 12.0% | 14.2% |
| Interquartile Range (IQR) | 2.5% | 5.8% |
| Standard Deviation (Sample) | 2.1% | 19.0% |
| Standard Deviation (Population) | 2.0% | 18.8% |
Similar Demographics by Divorced or Separated
Demographics Similar to Immigrants from Lithuania by Divorced or Separated
In terms of divorced or separated, the demographic groups most similar to Immigrants from Lithuania are Eastern European (11.3%, a difference of 0.11%), Immigrants from Yemen (11.3%, a difference of 0.12%), Immigrants from Philippines (11.3%, a difference of 0.19%), Immigrants from Vietnam (11.3%, a difference of 0.19%), and Immigrants from Australia (11.3%, a difference of 0.23%).
| Demographics | Rating | Rank | Divorced or Separated |
| Laotians | 100.0 /100 | #46 | Exceptional 11.2% |
| Immigrants | Poland | 100.0 /100 | #47 | Exceptional 11.2% |
| Immigrants | Turkey | 100.0 /100 | #48 | Exceptional 11.2% |
| Immigrants | Saudi Arabia | 100.0 /100 | #49 | Exceptional 11.2% |
| Bolivians | 100.0 /100 | #50 | Exceptional 11.2% |
| Immigrants | Bolivia | 100.0 /100 | #51 | Exceptional 11.3% |
| Immigrants | Australia | 99.9 /100 | #52 | Exceptional 11.3% |
| Immigrants | Lithuania | 99.9 /100 | #53 | Exceptional 11.3% |
| Eastern Europeans | 99.9 /100 | #54 | Exceptional 11.3% |
| Immigrants | Yemen | 99.9 /100 | #55 | Exceptional 11.3% |
| Immigrants | Philippines | 99.9 /100 | #56 | Exceptional 11.3% |
| Immigrants | Vietnam | 99.9 /100 | #57 | Exceptional 11.3% |
| Sri Lankans | 99.9 /100 | #58 | Exceptional 11.3% |
| Israelis | 99.9 /100 | #59 | Exceptional 11.3% |
| Immigrants | Russia | 99.9 /100 | #60 | Exceptional 11.3% |
Demographics Similar to Hungarians by Divorced or Separated
In terms of divorced or separated, the demographic groups most similar to Hungarians are Japanese (12.0%, a difference of 0.020%), Chilean (12.0%, a difference of 0.040%), Immigrants from Brazil (12.0%, a difference of 0.060%), Austrian (12.0%, a difference of 0.080%), and Immigrants from Hungary (11.9%, a difference of 0.15%).
| Demographics | Rating | Rank | Divorced or Separated |
| Immigrants | Oceania | 77.7 /100 | #149 | Good 11.9% |
| Immigrants | Portugal | 77.3 /100 | #150 | Good 11.9% |
| Czechs | 76.4 /100 | #151 | Good 11.9% |
| Immigrants | Hungary | 73.7 /100 | #152 | Good 11.9% |
| Austrians | 72.2 /100 | #153 | Good 12.0% |
| Chileans | 71.3 /100 | #154 | Good 12.0% |
| Japanese | 70.9 /100 | #155 | Good 12.0% |
| Hungarians | 70.3 /100 | #156 | Good 12.0% |
| Immigrants | Brazil | 68.8 /100 | #157 | Good 12.0% |
| Icelanders | 66.0 /100 | #158 | Good 12.0% |
| Immigrants | Barbados | 66.0 /100 | #159 | Good 12.0% |
| Immigrants | Scotland | 65.8 /100 | #160 | Good 12.0% |
| Marshallese | 64.6 /100 | #161 | Good 12.0% |
| Samoans | 64.3 /100 | #162 | Good 12.0% |
| Navajo | 63.9 /100 | #163 | Good 12.0% |