Immigrants from Jamaica vs Aleut Currently Married
COMPARE
Immigrants from Jamaica
Aleut
Currently Married
Currently Married Comparison
Immigrants from Jamaica
Aleuts
41.1%
CURRENTLY MARRIED
0.0/ 100
METRIC RATING
320th/ 347
METRIC RANK
46.7%
CURRENTLY MARRIED
52.0/ 100
METRIC RATING
172nd/ 347
METRIC RANK
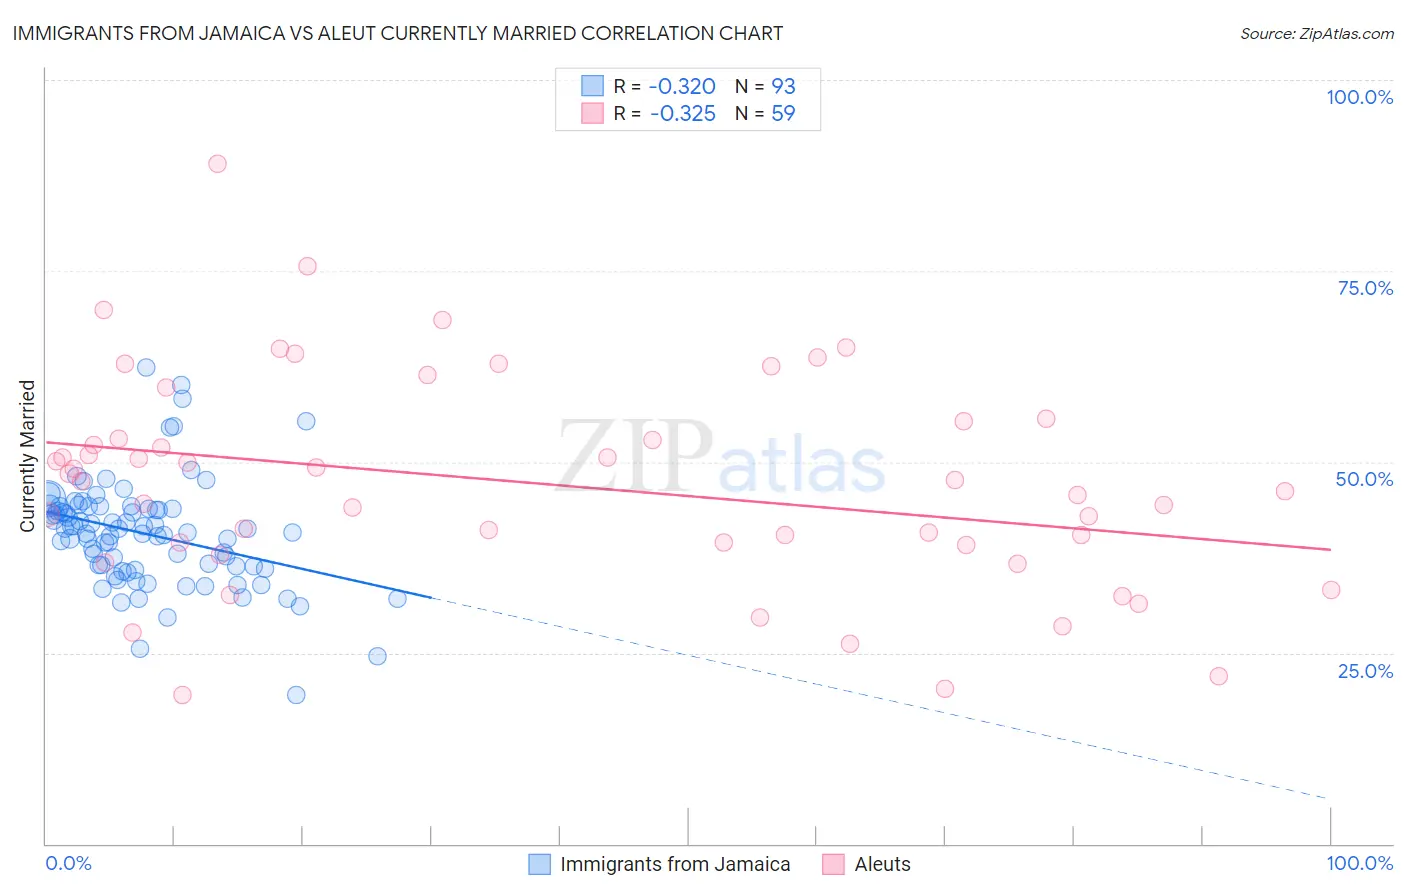
Immigrants from Jamaica vs Aleut Currently Married Correlation Chart
The statistical analysis conducted on geographies consisting of 301,800,438 people shows a mild negative correlation between the proportion of Immigrants from Jamaica and percentage of population currently married in the United States with a correlation coefficient (R) of -0.320 and weighted average of 41.1%. Similarly, the statistical analysis conducted on geographies consisting of 61,778,471 people shows a mild negative correlation between the proportion of Aleuts and percentage of population currently married in the United States with a correlation coefficient (R) of -0.325 and weighted average of 46.7%, a difference of 13.4%.
Currently Married Correlation Summary
| Measurement | Immigrants from Jamaica | Aleut |
| Minimum | 19.4% | 19.5% |
| Maximum | 62.4% | 89.1% |
| Range | 43.0% | 69.6% |
| Mean | 40.6% | 47.2% |
| Median | 40.8% | 47.4% |
| Interquartile 25% (IQ1) | 36.1% | 39.1% |
| Interquartile 75% (IQ3) | 44.0% | 55.3% |
| Interquartile Range (IQR) | 7.8% | 16.2% |
| Standard Deviation (Sample) | 7.0% | 14.0% |
| Standard Deviation (Population) | 7.0% | 13.9% |
Similar Demographics by Currently Married
Demographics Similar to Immigrants from Jamaica by Currently Married
In terms of currently married, the demographic groups most similar to Immigrants from Jamaica are Immigrants from Somalia (41.2%, a difference of 0.060%), Bahamian (41.2%, a difference of 0.080%), Immigrants from Congo (41.1%, a difference of 0.23%), Haitian (41.3%, a difference of 0.26%), and Immigrants from Caribbean (41.3%, a difference of 0.28%).
| Demographics | Rating | Rank | Currently Married |
| Jamaicans | 0.0 /100 | #313 | Tragic 41.4% |
| West Indians | 0.0 /100 | #314 | Tragic 41.3% |
| Inupiat | 0.0 /100 | #315 | Tragic 41.3% |
| Immigrants | Caribbean | 0.0 /100 | #316 | Tragic 41.3% |
| Haitians | 0.0 /100 | #317 | Tragic 41.3% |
| Bahamians | 0.0 /100 | #318 | Tragic 41.2% |
| Immigrants | Somalia | 0.0 /100 | #319 | Tragic 41.2% |
| Immigrants | Jamaica | 0.0 /100 | #320 | Tragic 41.1% |
| Immigrants | Congo | 0.0 /100 | #321 | Tragic 41.1% |
| Immigrants | Haiti | 0.0 /100 | #322 | Tragic 41.0% |
| Immigrants | West Indies | 0.0 /100 | #323 | Tragic 40.7% |
| Immigrants | Senegal | 0.0 /100 | #324 | Tragic 40.7% |
| U.S. Virgin Islanders | 0.0 /100 | #325 | Tragic 40.7% |
| Barbadians | 0.0 /100 | #326 | Tragic 40.6% |
| Senegalese | 0.0 /100 | #327 | Tragic 40.6% |
Demographics Similar to Aleuts by Currently Married
In terms of currently married, the demographic groups most similar to Aleuts are Immigrants from Zimbabwe (46.7%, a difference of 0.010%), Tlingit-Haida (46.7%, a difference of 0.030%), Peruvian (46.6%, a difference of 0.070%), Immigrants from Brazil (46.6%, a difference of 0.080%), and Hawaiian (46.6%, a difference of 0.13%).
| Demographics | Rating | Rank | Currently Married |
| Samoans | 59.8 /100 | #165 | Average 46.8% |
| Immigrants | Syria | 59.3 /100 | #166 | Average 46.8% |
| Spaniards | 58.8 /100 | #167 | Average 46.8% |
| Immigrants | Afghanistan | 58.2 /100 | #168 | Average 46.8% |
| Armenians | 58.2 /100 | #169 | Average 46.8% |
| Immigrants | Latvia | 56.7 /100 | #170 | Average 46.7% |
| Immigrants | Zimbabwe | 52.4 /100 | #171 | Average 46.7% |
| Aleuts | 52.0 /100 | #172 | Average 46.7% |
| Tlingit-Haida | 51.2 /100 | #173 | Average 46.7% |
| Peruvians | 50.0 /100 | #174 | Average 46.6% |
| Immigrants | Brazil | 49.9 /100 | #175 | Average 46.6% |
| Hawaiians | 48.6 /100 | #176 | Average 46.6% |
| Israelis | 48.6 /100 | #177 | Average 46.6% |
| Chickasaw | 47.8 /100 | #178 | Average 46.6% |
| Immigrants | Oceania | 44.6 /100 | #179 | Average 46.5% |