Immigrants from Grenada vs Immigrants from Serbia Currently Married
COMPARE
Immigrants from Grenada
Immigrants from Serbia
Currently Married
Currently Married Comparison
Immigrants from Grenada
Immigrants from Serbia
39.1%
CURRENTLY MARRIED
0.0/ 100
METRIC RATING
340th/ 347
METRIC RANK
47.0%
CURRENTLY MARRIED
68.8/ 100
METRIC RATING
152nd/ 347
METRIC RANK
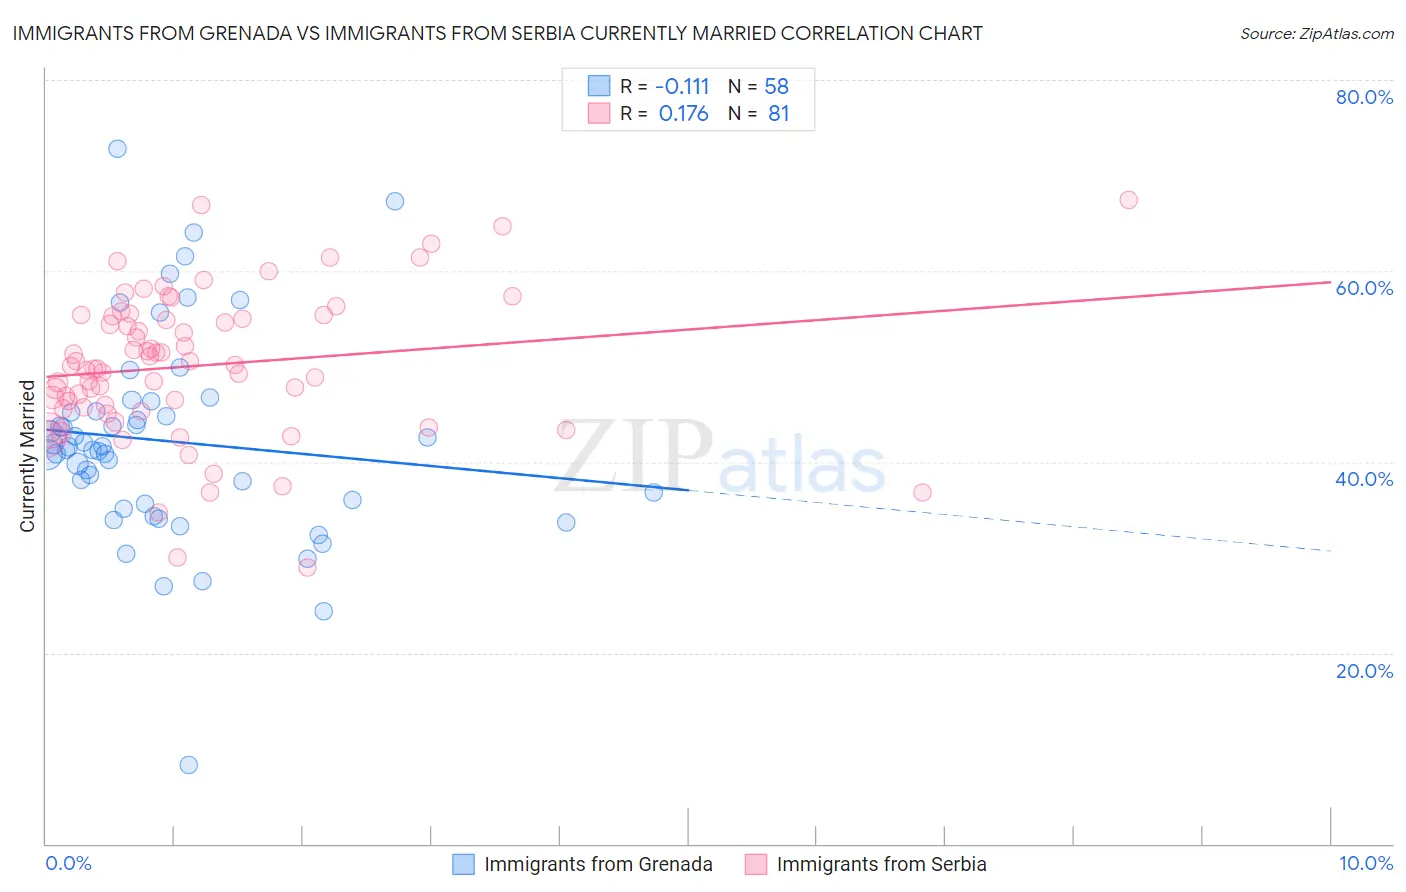
Immigrants from Grenada vs Immigrants from Serbia Currently Married Correlation Chart
The statistical analysis conducted on geographies consisting of 67,201,096 people shows a poor negative correlation between the proportion of Immigrants from Grenada and percentage of population currently married in the United States with a correlation coefficient (R) of -0.111 and weighted average of 39.1%. Similarly, the statistical analysis conducted on geographies consisting of 131,746,050 people shows a poor positive correlation between the proportion of Immigrants from Serbia and percentage of population currently married in the United States with a correlation coefficient (R) of 0.176 and weighted average of 47.0%, a difference of 20.0%.
Currently Married Correlation Summary
| Measurement | Immigrants from Grenada | Immigrants from Serbia |
| Minimum | 8.3% | 28.9% |
| Maximum | 72.8% | 67.4% |
| Range | 64.5% | 38.5% |
| Mean | 42.2% | 50.1% |
| Median | 41.4% | 50.1% |
| Interquartile 25% (IQ1) | 35.6% | 45.6% |
| Interquartile 75% (IQ3) | 45.4% | 55.3% |
| Interquartile Range (IQR) | 9.8% | 9.7% |
| Standard Deviation (Sample) | 10.9% | 7.6% |
| Standard Deviation (Population) | 10.8% | 7.6% |
Similar Demographics by Currently Married
Demographics Similar to Immigrants from Grenada by Currently Married
In terms of currently married, the demographic groups most similar to Immigrants from Grenada are Navajo (39.0%, a difference of 0.35%), Immigrants from Dominican Republic (38.9%, a difference of 0.52%), Dominican (39.5%, a difference of 0.96%), Cape Verdean (39.6%, a difference of 1.1%), and Black/African American (39.6%, a difference of 1.2%).
| Demographics | Rating | Rank | Currently Married |
| Yup'ik | 0.0 /100 | #333 | Tragic 39.9% |
| Puerto Ricans | 0.0 /100 | #334 | Tragic 39.9% |
| Lumbee | 0.0 /100 | #335 | Tragic 39.8% |
| British West Indians | 0.0 /100 | #336 | Tragic 39.8% |
| Blacks/African Americans | 0.0 /100 | #337 | Tragic 39.6% |
| Cape Verdeans | 0.0 /100 | #338 | Tragic 39.6% |
| Dominicans | 0.0 /100 | #339 | Tragic 39.5% |
| Immigrants | Grenada | 0.0 /100 | #340 | Tragic 39.1% |
| Navajo | 0.0 /100 | #341 | Tragic 39.0% |
| Immigrants | Dominican Republic | 0.0 /100 | #342 | Tragic 38.9% |
| Pueblo | 0.0 /100 | #343 | Tragic 38.2% |
| Immigrants | Cabo Verde | 0.0 /100 | #344 | Tragic 37.8% |
| Tohono O'odham | 0.0 /100 | #345 | Tragic 36.8% |
| Hopi | 0.0 /100 | #346 | Tragic 36.5% |
| Pima | 0.0 /100 | #347 | Tragic 35.9% |
Demographics Similar to Immigrants from Serbia by Currently Married
In terms of currently married, the demographic groups most similar to Immigrants from Serbia are Immigrants from Venezuela (47.0%, a difference of 0.010%), Albanian (47.0%, a difference of 0.010%), Arab (47.0%, a difference of 0.010%), Spanish (47.0%, a difference of 0.030%), and Chilean (47.0%, a difference of 0.040%).
| Demographics | Rating | Rank | Currently Married |
| Immigrants | South Eastern Asia | 72.9 /100 | #145 | Good 47.1% |
| Carpatho Rusyns | 72.6 /100 | #146 | Good 47.0% |
| Immigrants | Argentina | 72.0 /100 | #147 | Good 47.0% |
| Cambodians | 70.4 /100 | #148 | Good 47.0% |
| Zimbabweans | 70.1 /100 | #149 | Good 47.0% |
| Immigrants | Turkey | 70.0 /100 | #150 | Good 47.0% |
| Chileans | 69.8 /100 | #151 | Good 47.0% |
| Immigrants | Serbia | 68.8 /100 | #152 | Good 47.0% |
| Immigrants | Venezuela | 68.6 /100 | #153 | Good 47.0% |
| Albanians | 68.6 /100 | #154 | Good 47.0% |
| Arabs | 68.6 /100 | #155 | Good 47.0% |
| Spanish | 68.1 /100 | #156 | Good 47.0% |
| Immigrants | Switzerland | 67.8 /100 | #157 | Good 46.9% |
| Cherokee | 66.8 /100 | #158 | Good 46.9% |
| Iraqis | 66.4 /100 | #159 | Good 46.9% |