Immigrants from Fiji vs Immigrants from South Eastern Asia Divorced or Separated
COMPARE
Immigrants from Fiji
Immigrants from South Eastern Asia
Divorced or Separated
Divorced or Separated Comparison
Immigrants from Fiji
Immigrants from South Eastern Asia
11.6%
DIVORCED OR SEPARATED
98.9/ 100
METRIC RATING
94th/ 347
METRIC RANK
11.4%
DIVORCED OR SEPARATED
99.8/ 100
METRIC RATING
65th/ 347
METRIC RANK
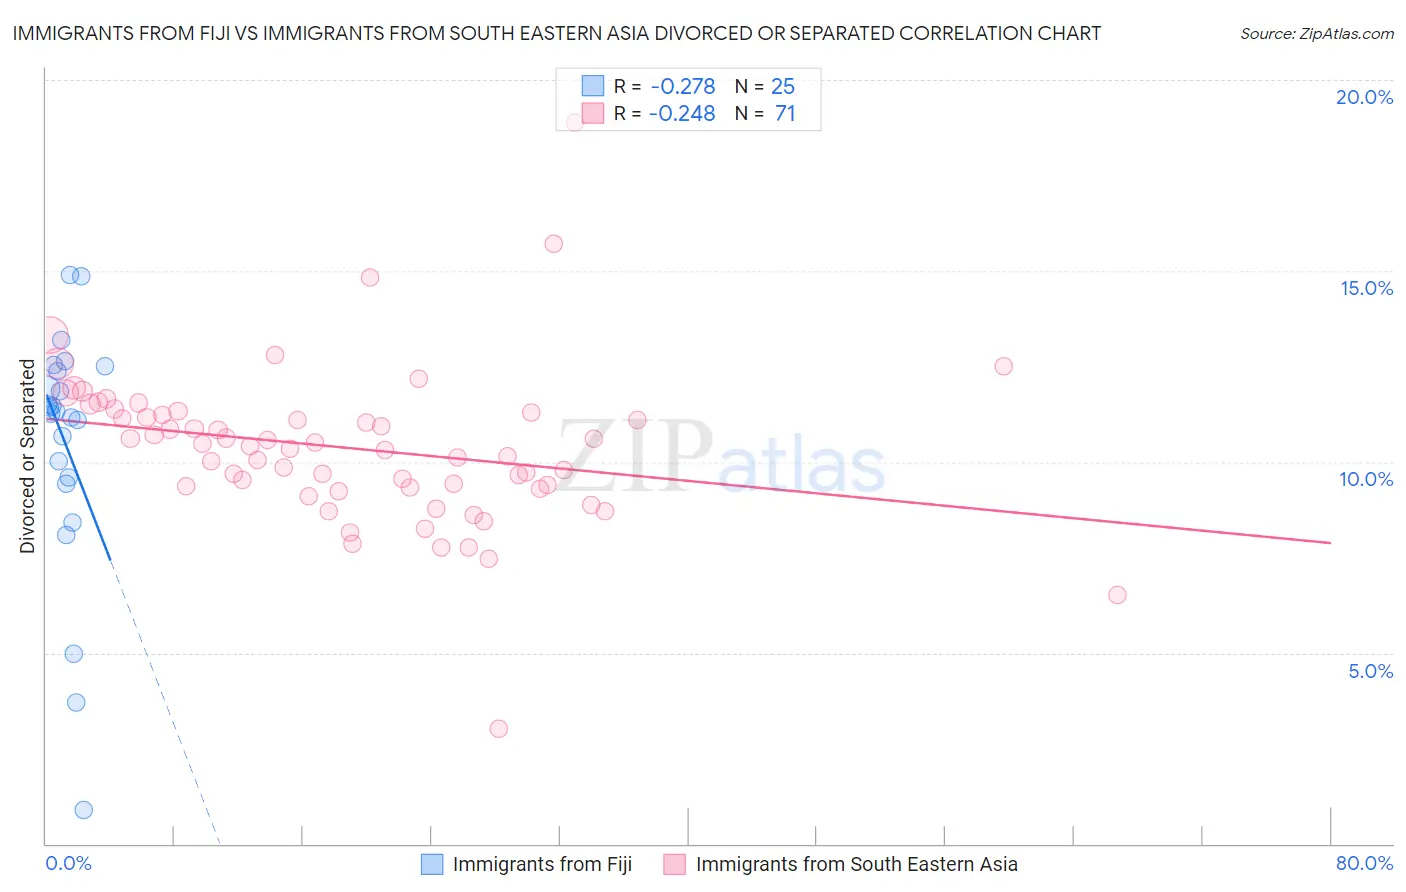
Immigrants from Fiji vs Immigrants from South Eastern Asia Divorced or Separated Correlation Chart
The statistical analysis conducted on geographies consisting of 93,755,407 people shows a weak negative correlation between the proportion of Immigrants from Fiji and percentage of population currently divorced or separated in the United States with a correlation coefficient (R) of -0.278 and weighted average of 11.6%. Similarly, the statistical analysis conducted on geographies consisting of 512,413,188 people shows a weak negative correlation between the proportion of Immigrants from South Eastern Asia and percentage of population currently divorced or separated in the United States with a correlation coefficient (R) of -0.248 and weighted average of 11.4%, a difference of 1.5%.
Divorced or Separated Correlation Summary
| Measurement | Immigrants from Fiji | Immigrants from South Eastern Asia |
| Minimum | 0.90% | 3.0% |
| Maximum | 14.9% | 18.9% |
| Range | 14.0% | 15.9% |
| Mean | 10.5% | 10.4% |
| Median | 11.3% | 10.4% |
| Interquartile 25% (IQ1) | 9.5% | 9.3% |
| Interquartile 75% (IQ3) | 12.4% | 11.3% |
| Interquartile Range (IQR) | 2.9% | 2.0% |
| Standard Deviation (Sample) | 3.2% | 2.1% |
| Standard Deviation (Population) | 3.2% | 2.1% |
Similar Demographics by Divorced or Separated
Demographics Similar to Immigrants from Fiji by Divorced or Separated
In terms of divorced or separated, the demographic groups most similar to Immigrants from Fiji are Immigrants from Denmark (11.6%, a difference of 0.010%), Arab (11.6%, a difference of 0.010%), Spanish American Indian (11.6%, a difference of 0.070%), Immigrants from Serbia (11.6%, a difference of 0.10%), and Zimbabwean (11.6%, a difference of 0.11%).
| Demographics | Rating | Rank | Divorced or Separated |
| Immigrants | Nepal | 99.2 /100 | #87 | Exceptional 11.6% |
| Immigrants | Europe | 99.2 /100 | #88 | Exceptional 11.6% |
| Immigrants | Southern Europe | 99.1 /100 | #89 | Exceptional 11.6% |
| Zimbabweans | 99.0 /100 | #90 | Exceptional 11.6% |
| Spanish American Indians | 99.0 /100 | #91 | Exceptional 11.6% |
| Immigrants | Denmark | 98.9 /100 | #92 | Exceptional 11.6% |
| Arabs | 98.9 /100 | #93 | Exceptional 11.6% |
| Immigrants | Fiji | 98.9 /100 | #94 | Exceptional 11.6% |
| Immigrants | Serbia | 98.8 /100 | #95 | Exceptional 11.6% |
| Immigrants | Ukraine | 98.7 /100 | #96 | Exceptional 11.6% |
| Latvians | 98.7 /100 | #97 | Exceptional 11.6% |
| Immigrants | Jordan | 98.6 /100 | #98 | Exceptional 11.6% |
| Immigrants | Sweden | 98.6 /100 | #99 | Exceptional 11.6% |
| Immigrants | Northern Europe | 98.6 /100 | #100 | Exceptional 11.6% |
| Immigrants | Guyana | 98.5 /100 | #101 | Exceptional 11.6% |
Demographics Similar to Immigrants from South Eastern Asia by Divorced or Separated
In terms of divorced or separated, the demographic groups most similar to Immigrants from South Eastern Asia are Macedonian (11.4%, a difference of 0.040%), Inupiat (11.4%, a difference of 0.14%), Immigrants from Syria (11.4%, a difference of 0.23%), Palestinian (11.5%, a difference of 0.34%), and Immigrants from Belgium (11.5%, a difference of 0.34%).
| Demographics | Rating | Rank | Divorced or Separated |
| Sri Lankans | 99.9 /100 | #58 | Exceptional 11.3% |
| Israelis | 99.9 /100 | #59 | Exceptional 11.3% |
| Immigrants | Russia | 99.9 /100 | #60 | Exceptional 11.3% |
| Koreans | 99.9 /100 | #61 | Exceptional 11.3% |
| Luxembourgers | 99.9 /100 | #62 | Exceptional 11.3% |
| Immigrants | Kuwait | 99.9 /100 | #63 | Exceptional 11.3% |
| Macedonians | 99.8 /100 | #64 | Exceptional 11.4% |
| Immigrants | South Eastern Asia | 99.8 /100 | #65 | Exceptional 11.4% |
| Inupiat | 99.8 /100 | #66 | Exceptional 11.4% |
| Immigrants | Syria | 99.7 /100 | #67 | Exceptional 11.4% |
| Palestinians | 99.7 /100 | #68 | Exceptional 11.5% |
| Immigrants | Belgium | 99.7 /100 | #69 | Exceptional 11.5% |
| Immigrants | Eastern Europe | 99.7 /100 | #70 | Exceptional 11.5% |
| Paraguayans | 99.7 /100 | #71 | Exceptional 11.5% |
| Jordanians | 99.6 /100 | #72 | Exceptional 11.5% |