Danish vs Immigrants from South Eastern Asia Divorced or Separated

COMPARE

Danish
Race
Ancestry
AfghanAfricanAlaska NativeAlaskan AthabascanAlbanianAleutAlsatianAmericanApacheArabArapahoArgentineanArmenianAssyrian/Chaldean/SyriacAustralianAustrianBahamianBangladeshiBarbadianBasqueBelgianBelizeanBermudanBhutaneseBlackfeetBolivianBrazilianBritishBritish West IndianBulgarianBurmeseCajunCambodianCanadianCape VerdeanCarpatho RusynCelticCentral AmericanCentral American IndianCherokeeCheyenneChickasawChileanChineseChippewaChoctawColombianColvilleComancheCosta RicanCreeCreekCroatianCrowCubanCypriotCzechCzechoslovakianDanishDelawareDominicanDutchDutch West IndianEastern EuropeanEcuadorianEgyptianEnglishEstonianEthiopianEuropeanFijianFilipinoFinnishFrenchFrench American IndianFrench CanadianGermanGerman RussianGhanaianGreekGuamanian/ChamorroGuatemalanGuyaneseHaitianHmongHonduranHopiHoumaHungarianIcelanderIndian (Asian)IndonesianInupiatIranianIraqiIrishIroquoisIsraeliItalianJamaicanJapaneseJordanianKenyanKiowaKoreanLaotianLatvianLebaneseLiberianLithuanianLumbeeLuxembourgerMacedonianMalaysianMalteseMarshalleseMenomineeMexicanMexican American IndianMongolianMoroccanNative HawaiianNavajoNepaleseNew ZealanderNicaraguanNigerianNorthern EuropeanNorwegianOkinawanOsageOttawaPaiutePakistaniPalestinianPanamanianParaguayanPennsylvania GermanPeruvianPimaPolishPortuguesePotawatomiPuebloPuerto RicanPuget Sound SalishRomanianRussianSalvadoranSamoanScandinavianScotch-IrishScottishSeminoleSenegaleseSerbianShoshoneSierra LeoneanSiouxSlavicSlovakSloveneSomaliSouth AfricanSouth AmericanSouth American IndianSoviet UnionSpaniardSpanishSpanish AmericanSpanish American IndianSri LankanSubsaharan AfricanSudaneseSwedishSwissSyrianTaiwaneseThaiTlingit-HaidaTohono O'OdhamTonganTrinidadian and TobagonianTsimshianTurkishU.S. Virgin IslanderUgandanUkrainianUruguayanUteVenezuelanVietnameseWelshWest IndianYakamaYaquiYugoslavianYumanYup'ikZimbabwean
Immigration
NonimmigrantsImmigrantsAfghanistanAfricaAlbaniaArgentinaArmeniaAsiaAustraliaAustriaBahamasBangladeshBarbadosBelarusBelgiumBelizeBoliviaBosnia and HerzegovinaBrazilBulgariaBurma/MyanmarCabo VerdeCambodiaCameroonCanadaCaribbeanCentral AmericaChileChinaColombiaCongoCosta RicaCroatiaCubaCzechoslovakiaDenmarkDominicaDominican RepublicEastern AfricaEastern AsiaEastern EuropeEcuadorEgyptEl SalvadorEnglandEritreaEthiopiaEuropeFijiFranceGermanyGhanaGreeceGrenadaGuatemalaGuyanaHaitiHondurasHong KongHungaryIndiaIndonesiaIranIraqIrelandIsraelItalyJamaicaJapanJordanKazakhstanKenyaKoreaKuwaitLaosLatin AmericaLatviaLebanonLiberiaLithuaniaMalaysiaMexicoMicronesiaMiddle AfricaMoldovaMoroccoNepalNetherlandsNicaraguaNigeriaNorth AmericaNorth MacedoniaNorthern AfricaNorthern EuropeNorwayOceaniaPakistanPanamaPeruPhilippinesPolandPortugalRomaniaRussiaSaudi ArabiaScotlandSenegalSerbiaSierra LeoneSingaporeSomaliaSouth AfricaSouth AmericaSouth Central AsiaSouthern EuropeSpainSri LankaSt. Vincent and the GrenadinesSudanSwedenSwitzerlandSyriaTaiwanThailandTrinidad and TobagoTurkeyUgandaUkraineUruguayUzbekistanVenezuelaVietnamWest IndiesWestern AfricaWestern AsiaWestern EuropeYemenZaireZimbabweAzores
Immigrants from South Eastern Asia
Race
Ancestry
AfghanAfricanAlaska NativeAlaskan AthabascanAlbanianAleutAlsatianAmericanApacheArabArapahoArgentineanArmenianAssyrian/Chaldean/SyriacAustralianAustrianBahamianBangladeshiBarbadianBasqueBelgianBelizeanBermudanBhutaneseBlackfeetBolivianBrazilianBritishBritish West IndianBulgarianBurmeseCajunCambodianCanadianCape VerdeanCarpatho RusynCelticCentral AmericanCentral American IndianCherokeeCheyenneChickasawChileanChineseChippewaChoctawColombianColvilleComancheCosta RicanCreeCreekCroatianCrowCubanCypriotCzechCzechoslovakianDelawareDominicanDutchDutch West IndianEastern EuropeanEcuadorianEgyptianEnglishEstonianEthiopianEuropeanFijianFilipinoFinnishFrenchFrench American IndianFrench CanadianGermanGerman RussianGhanaianGreekGuamanian/ChamorroGuatemalanGuyaneseHaitianHmongHonduranHopiHoumaHungarianIcelanderIndian (Asian)IndonesianInupiatIranianIraqiIrishIroquoisIsraeliItalianJamaicanJapaneseJordanianKenyanKiowaKoreanLaotianLatvianLebaneseLiberianLithuanianLumbeeLuxembourgerMacedonianMalaysianMalteseMarshalleseMenomineeMexicanMexican American IndianMongolianMoroccanNative HawaiianNavajoNepaleseNew ZealanderNicaraguanNigerianNorthern EuropeanNorwegianOkinawanOsageOttawaPaiutePakistaniPalestinianPanamanianParaguayanPennsylvania GermanPeruvianPimaPolishPortuguesePotawatomiPuebloPuerto RicanPuget Sound SalishRomanianRussianSalvadoranSamoanScandinavianScotch-IrishScottishSeminoleSenegaleseSerbianShoshoneSierra LeoneanSiouxSlavicSlovakSloveneSomaliSouth AfricanSouth AmericanSouth American IndianSoviet UnionSpaniardSpanishSpanish AmericanSpanish American IndianSri LankanSubsaharan AfricanSudaneseSwedishSwissSyrianTaiwaneseThaiTlingit-HaidaTohono O'OdhamTonganTrinidadian and TobagonianTsimshianTurkishU.S. Virgin IslanderUgandanUkrainianUruguayanUteVenezuelanVietnameseWelshWest IndianYakamaYaquiYugoslavianYumanYup'ikZimbabwean
Immigration
NonimmigrantsImmigrantsAfghanistanAfricaAlbaniaArgentinaArmeniaAsiaAustraliaAustriaBahamasBangladeshBarbadosBelarusBelgiumBelizeBoliviaBosnia and HerzegovinaBrazilBulgariaBurma/MyanmarCabo VerdeCambodiaCameroonCanadaCaribbeanCentral AmericaChileChinaColombiaCongoCosta RicaCroatiaCubaCzechoslovakiaDenmarkDominicaDominican RepublicEastern AfricaEastern AsiaEastern EuropeEcuadorEgyptEl SalvadorEnglandEritreaEthiopiaEuropeFijiFranceGermanyGhanaGreeceGrenadaGuatemalaGuyanaHaitiHondurasHong KongHungaryIndiaIndonesiaIranIraqIrelandIsraelItalyJamaicaJapanJordanKazakhstanKenyaKoreaKuwaitLaosLatin AmericaLatviaLebanonLiberiaLithuaniaMalaysiaMexicoMicronesiaMiddle AfricaMoldovaMoroccoNepalNetherlandsNicaraguaNigeriaNorth AmericaNorth MacedoniaNorthern AfricaNorthern EuropeNorwayOceaniaPakistanPanamaPeruPhilippinesPolandPortugalRomaniaRussiaSaudi ArabiaScotlandSenegalSerbiaSierra LeoneSingaporeSomaliaSouth AfricaSouth AmericaSouth Central AsiaSouth Eastern AsiaSouthern EuropeSpainSri LankaSt. Vincent and the GrenadinesSudanSwedenSwitzerlandSyriaTaiwanThailandTrinidad and TobagoTurkeyUgandaUkraineUruguayUzbekistanVenezuelaVietnamWest IndiesWestern AfricaWestern AsiaWestern EuropeYemenZaireZimbabweAzores
Divorced or Separated
Income
Poverty
Unemployment
Labor Participation
Family Structure
Vehicle Availability
Education Level
Disability

Divorced or Separated Comparison

Danes

Immigrants from South Eastern Asia

Excellent
Exceptional
11.9%
DIVORCED OR SEPARATED
84.8/ 100
METRIC RATING
135th/ 347
METRIC RANK
11.4%
DIVORCED OR SEPARATED
99.8/ 100
METRIC RATING
65th/ 347
METRIC RANK

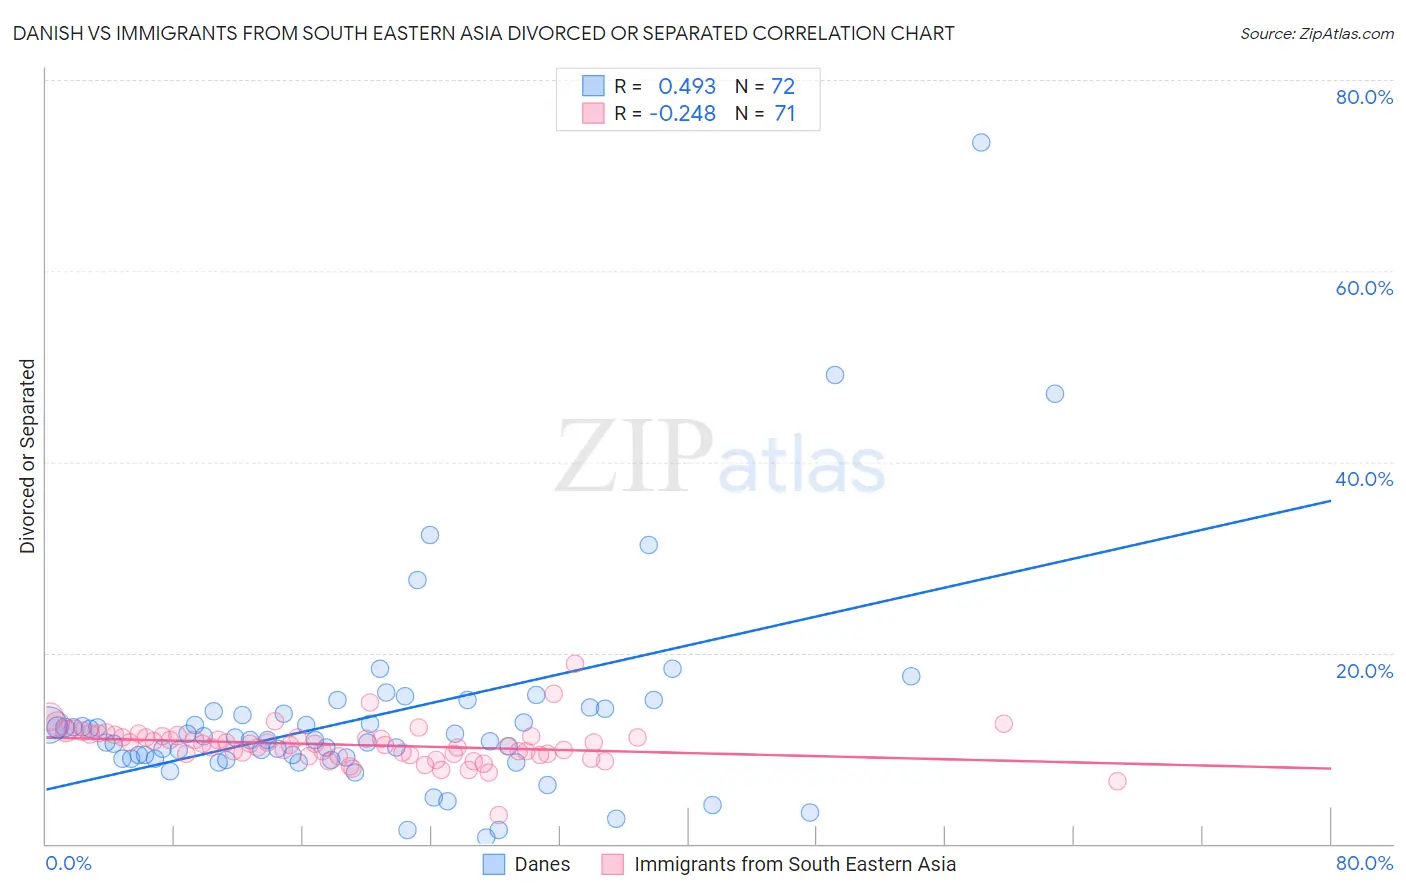
Danish vs Immigrants from South Eastern Asia Divorced or Separated Correlation Chart

The statistical analysis conducted on geographies consisting of 473,966,187 people shows a moderate positive correlation between the proportion of Danes and percentage of population currently divorced or separated in the United States with a correlation coefficient (R) of 0.493 and weighted average of 11.9%. Similarly, the statistical analysis conducted on geographies consisting of 512,413,188 people shows a weak negative correlation between the proportion of Immigrants from South Eastern Asia and percentage of population currently divorced or separated in the United States with a correlation coefficient (R) of -0.248 and weighted average of 11.4%, a difference of 4.1%.
Danish vs Immigrants from South Eastern Asia Divorced or Separated

Divorced or Separated Correlation Summary

MeasurementDanishImmigrants from South Eastern Asia
Minimum0.70%3.0%
Maximum73.4%18.9%
Range72.7%15.9%
Mean13.2%10.4%
Median10.9%10.4%
Interquartile 25% (IQ1)8.9%9.3%
Interquartile 75% (IQ3)13.8%11.3%
Interquartile Range (IQR)4.8%2.0%
Standard Deviation (Sample)10.9%2.1%
Standard Deviation (Population)10.8%2.1%

Similar Demographics by Divorced or Separated

Demographics Similar to Danes by Divorced or Separated

In terms of divorced or separated, the demographic groups most similar to Danes are Carpatho Rusyn (11.9%, a difference of 0.0%), Argentinean (11.9%, a difference of 0.020%), Alsatian (11.9%, a difference of 0.060%), Immigrants from Netherlands (11.9%, a difference of 0.060%), and Australian (11.9%, a difference of 0.080%).
DemographicsRating | RankDivorced or Separated
Immigrants | Ecuador
88.9
/100
|
#128
Excellent
11.8%
Immigrants | St. Vincent and the Grenadines
88.4
/100
|
#129
Excellent
11.8%
Immigrants | Austria
88.2
/100
|
#130
Excellent
11.8%
Immigrants | Cambodia
88.2
/100
|
#131
Excellent
11.8%
Immigrants | Afghanistan
87.9
/100
|
#132
Excellent
11.8%
New Zealanders
87.5
/100
|
#133
Excellent
11.9%
Argentineans
85.1
/100
|
#134
Excellent
11.9%
Danes
84.8
/100
|
#135
Excellent
11.9%
Carpatho Rusyns
84.8
/100
|
#136
Excellent
11.9%
Alsatians
84.0
/100
|
#137
Excellent
11.9%
Immigrants | Netherlands
83.9
/100
|
#138
Excellent
11.9%
Australians
83.6
/100
|
#139
Excellent
11.9%
Lebanese
83.4
/100
|
#140
Excellent
11.9%
Immigrants | Morocco
82.9
/100
|
#141
Excellent
11.9%
Immigrants | Zimbabwe
81.5
/100
|
#142
Excellent
11.9%

Demographics Similar to Immigrants from South Eastern Asia by Divorced or Separated

In terms of divorced or separated, the demographic groups most similar to Immigrants from South Eastern Asia are Macedonian (11.4%, a difference of 0.040%), Inupiat (11.4%, a difference of 0.14%), Immigrants from Syria (11.4%, a difference of 0.23%), Palestinian (11.5%, a difference of 0.34%), and Immigrants from Belgium (11.5%, a difference of 0.34%).
DemographicsRating | RankDivorced or Separated
Sri Lankans
99.9
/100
|
#58
Exceptional
11.3%
Israelis
99.9
/100
|
#59
Exceptional
11.3%
Immigrants | Russia
99.9
/100
|
#60
Exceptional
11.3%
Koreans
99.9
/100
|
#61
Exceptional
11.3%
Luxembourgers
99.9
/100
|
#62
Exceptional
11.3%
Immigrants | Kuwait
99.9
/100
|
#63
Exceptional
11.3%
Macedonians
99.8
/100
|
#64
Exceptional
11.4%
Immigrants | South Eastern Asia
99.8
/100
|
#65
Exceptional
11.4%
Inupiat
99.8
/100
|
#66
Exceptional
11.4%
Immigrants | Syria
99.7
/100
|
#67
Exceptional
11.4%
Palestinians
99.7
/100
|
#68
Exceptional
11.5%
Immigrants | Belgium
99.7
/100
|
#69
Exceptional
11.5%
Immigrants | Eastern Europe
99.7
/100
|
#70
Exceptional
11.5%
Paraguayans
99.7
/100
|
#71
Exceptional
11.5%
Jordanians
99.6
/100
|
#72
Exceptional
11.5%