Immigrants from Egypt vs Immigrants from Belize Divorced or Separated
COMPARE
Immigrants from Egypt
Immigrants from Belize
Divorced or Separated
Divorced or Separated Comparison
Immigrants from Egypt
Immigrants from Belize
11.1%
DIVORCED OR SEPARATED
100.0/ 100
METRIC RATING
39th/ 347
METRIC RANK
12.1%
DIVORCED OR SEPARATED
37.6/ 100
METRIC RATING
188th/ 347
METRIC RANK
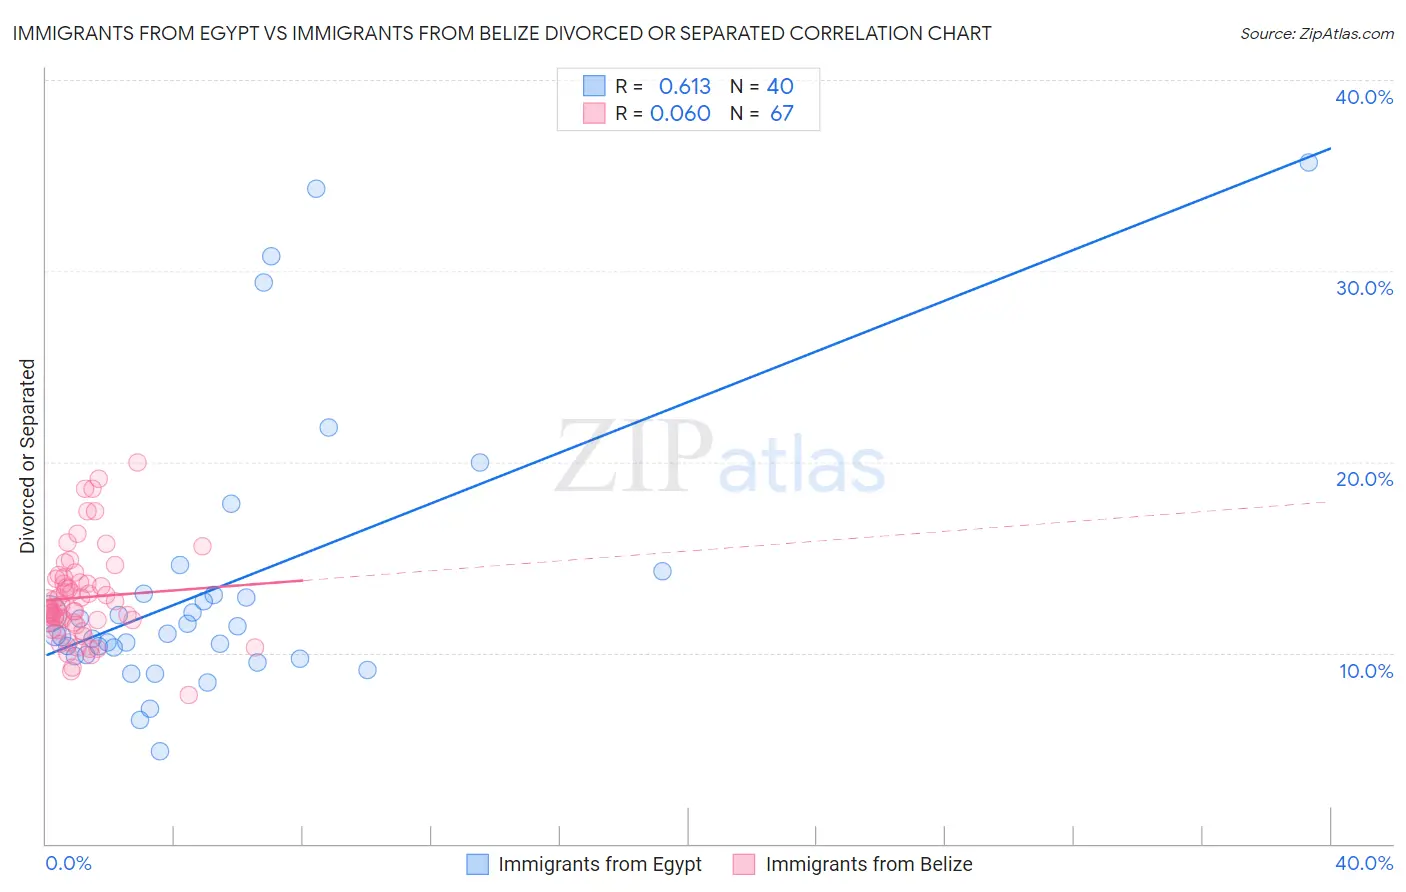
Immigrants from Egypt vs Immigrants from Belize Divorced or Separated Correlation Chart
The statistical analysis conducted on geographies consisting of 245,438,594 people shows a significant positive correlation between the proportion of Immigrants from Egypt and percentage of population currently divorced or separated in the United States with a correlation coefficient (R) of 0.613 and weighted average of 11.1%. Similarly, the statistical analysis conducted on geographies consisting of 130,317,505 people shows a slight positive correlation between the proportion of Immigrants from Belize and percentage of population currently divorced or separated in the United States with a correlation coefficient (R) of 0.060 and weighted average of 12.1%, a difference of 8.7%.
Divorced or Separated Correlation Summary
| Measurement | Immigrants from Egypt | Immigrants from Belize |
| Minimum | 4.8% | 7.8% |
| Maximum | 35.7% | 20.0% |
| Range | 30.9% | 12.2% |
| Mean | 13.5% | 12.9% |
| Median | 10.9% | 12.3% |
| Interquartile 25% (IQ1) | 9.8% | 11.6% |
| Interquartile 75% (IQ3) | 13.0% | 13.9% |
| Interquartile Range (IQR) | 3.2% | 2.3% |
| Standard Deviation (Sample) | 7.2% | 2.4% |
| Standard Deviation (Population) | 7.1% | 2.4% |
Similar Demographics by Divorced or Separated
Demographics Similar to Immigrants from Egypt by Divorced or Separated
In terms of divorced or separated, the demographic groups most similar to Immigrants from Egypt are Soviet Union (11.1%, a difference of 0.090%), Immigrants from Greece (11.1%, a difference of 0.24%), Immigrants from Lebanon (11.1%, a difference of 0.30%), Immigrants from Japan (11.1%, a difference of 0.31%), and Bhutanese (11.2%, a difference of 0.36%).
| Demographics | Rating | Rank | Divorced or Separated |
| Tongans | 100.0 /100 | #32 | Exceptional 11.1% |
| Egyptians | 100.0 /100 | #33 | Exceptional 11.1% |
| Immigrants | Uzbekistan | 100.0 /100 | #34 | Exceptional 11.1% |
| Cambodians | 100.0 /100 | #35 | Exceptional 11.1% |
| Immigrants | Japan | 100.0 /100 | #36 | Exceptional 11.1% |
| Immigrants | Lebanon | 100.0 /100 | #37 | Exceptional 11.1% |
| Immigrants | Greece | 100.0 /100 | #38 | Exceptional 11.1% |
| Immigrants | Egypt | 100.0 /100 | #39 | Exceptional 11.1% |
| Soviet Union | 100.0 /100 | #40 | Exceptional 11.1% |
| Bhutanese | 100.0 /100 | #41 | Exceptional 11.2% |
| Chinese | 100.0 /100 | #42 | Exceptional 11.2% |
| Immigrants | Belarus | 100.0 /100 | #43 | Exceptional 11.2% |
| Immigrants | Western Asia | 100.0 /100 | #44 | Exceptional 11.2% |
| Turks | 100.0 /100 | #45 | Exceptional 11.2% |
| Laotians | 100.0 /100 | #46 | Exceptional 11.2% |
Demographics Similar to Immigrants from Belize by Divorced or Separated
In terms of divorced or separated, the demographic groups most similar to Immigrants from Belize are Belizean (12.1%, a difference of 0.0%), Immigrants from Chile (12.1%, a difference of 0.050%), Sierra Leonean (12.1%, a difference of 0.080%), Moroccan (12.1%, a difference of 0.10%), and Immigrants from Nigeria (12.1%, a difference of 0.11%).
| Demographics | Rating | Rank | Divorced or Separated |
| Immigrants | Canada | 44.0 /100 | #181 | Average 12.1% |
| Immigrants | Ethiopia | 43.1 /100 | #182 | Average 12.1% |
| Immigrants | Central America | 42.9 /100 | #183 | Average 12.1% |
| Immigrants | North America | 41.1 /100 | #184 | Average 12.1% |
| Immigrants | Nigeria | 40.5 /100 | #185 | Average 12.1% |
| Immigrants | Chile | 39.0 /100 | #186 | Fair 12.1% |
| Belizeans | 37.7 /100 | #187 | Fair 12.1% |
| Immigrants | Belize | 37.6 /100 | #188 | Fair 12.1% |
| Sierra Leoneans | 35.5 /100 | #189 | Fair 12.1% |
| Moroccans | 34.8 /100 | #190 | Fair 12.1% |
| Swedes | 34.4 /100 | #191 | Fair 12.1% |
| Norwegians | 33.2 /100 | #192 | Fair 12.1% |
| Immigrants | Thailand | 32.5 /100 | #193 | Fair 12.1% |
| Immigrants | Eritrea | 31.9 /100 | #194 | Fair 12.1% |
| Immigrants | England | 31.4 /100 | #195 | Fair 12.1% |