Immigrants from Egypt vs Creek Divorced or Separated
COMPARE
Immigrants from Egypt
Creek
Divorced or Separated
Divorced or Separated Comparison
Immigrants from Egypt
Creek
11.1%
DIVORCED OR SEPARATED
100.0/ 100
METRIC RATING
39th/ 347
METRIC RANK
14.4%
DIVORCED OR SEPARATED
0.0/ 100
METRIC RATING
343rd/ 347
METRIC RANK
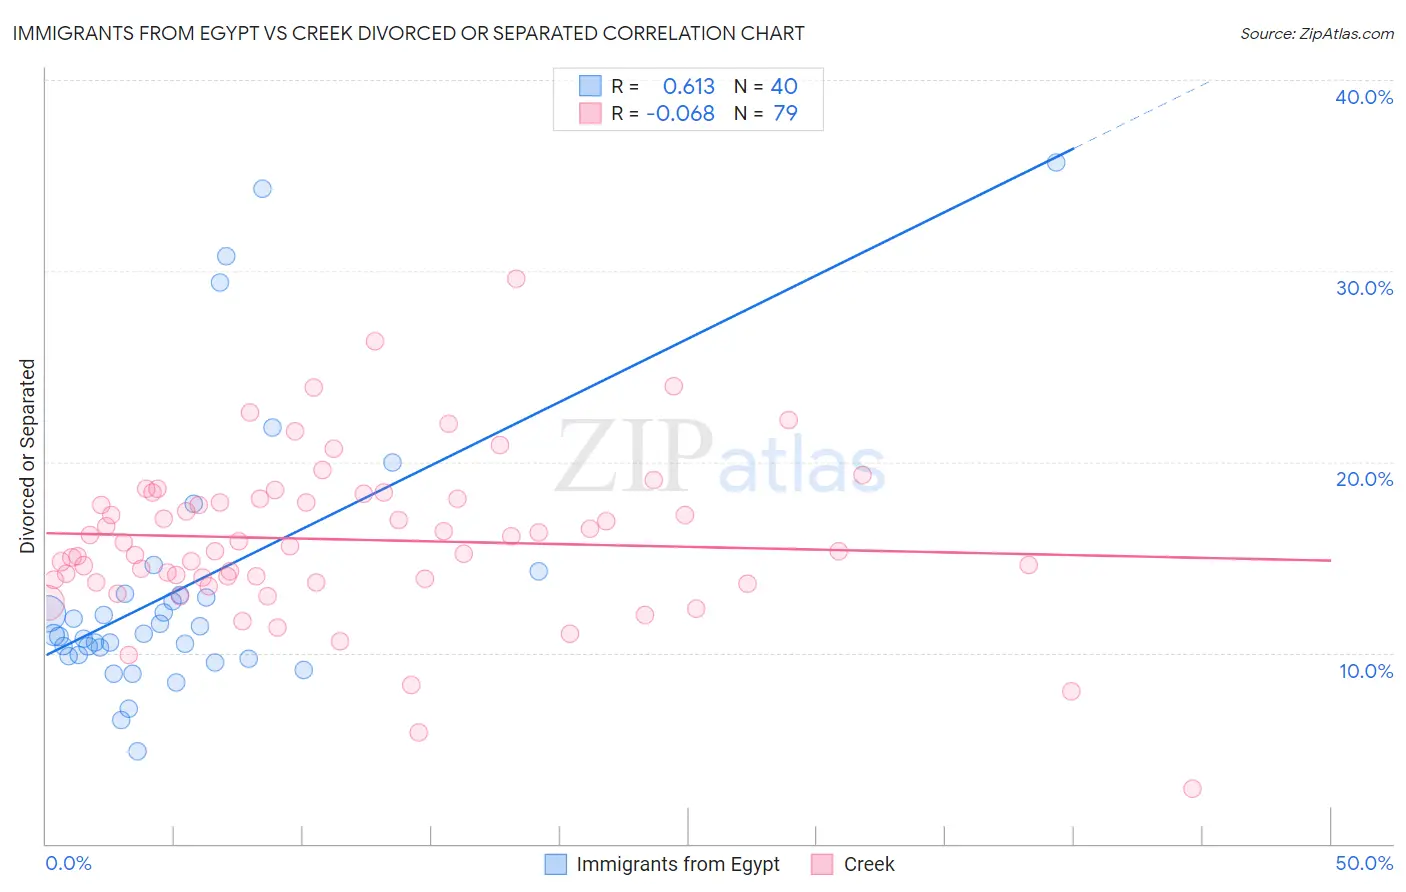
Immigrants from Egypt vs Creek Divorced or Separated Correlation Chart
The statistical analysis conducted on geographies consisting of 245,438,594 people shows a significant positive correlation between the proportion of Immigrants from Egypt and percentage of population currently divorced or separated in the United States with a correlation coefficient (R) of 0.613 and weighted average of 11.1%. Similarly, the statistical analysis conducted on geographies consisting of 178,467,072 people shows a slight negative correlation between the proportion of Creek and percentage of population currently divorced or separated in the United States with a correlation coefficient (R) of -0.068 and weighted average of 14.4%, a difference of 29.3%.
Divorced or Separated Correlation Summary
| Measurement | Immigrants from Egypt | Creek |
| Minimum | 4.8% | 2.9% |
| Maximum | 35.7% | 29.6% |
| Range | 30.9% | 26.7% |
| Mean | 13.5% | 15.9% |
| Median | 10.9% | 15.6% |
| Interquartile 25% (IQ1) | 9.8% | 13.8% |
| Interquartile 75% (IQ3) | 13.0% | 18.1% |
| Interquartile Range (IQR) | 3.2% | 4.3% |
| Standard Deviation (Sample) | 7.2% | 4.2% |
| Standard Deviation (Population) | 7.1% | 4.2% |
Similar Demographics by Divorced or Separated
Demographics Similar to Immigrants from Egypt by Divorced or Separated
In terms of divorced or separated, the demographic groups most similar to Immigrants from Egypt are Soviet Union (11.1%, a difference of 0.090%), Immigrants from Greece (11.1%, a difference of 0.24%), Immigrants from Lebanon (11.1%, a difference of 0.30%), Immigrants from Japan (11.1%, a difference of 0.31%), and Bhutanese (11.2%, a difference of 0.36%).
| Demographics | Rating | Rank | Divorced or Separated |
| Tongans | 100.0 /100 | #32 | Exceptional 11.1% |
| Egyptians | 100.0 /100 | #33 | Exceptional 11.1% |
| Immigrants | Uzbekistan | 100.0 /100 | #34 | Exceptional 11.1% |
| Cambodians | 100.0 /100 | #35 | Exceptional 11.1% |
| Immigrants | Japan | 100.0 /100 | #36 | Exceptional 11.1% |
| Immigrants | Lebanon | 100.0 /100 | #37 | Exceptional 11.1% |
| Immigrants | Greece | 100.0 /100 | #38 | Exceptional 11.1% |
| Immigrants | Egypt | 100.0 /100 | #39 | Exceptional 11.1% |
| Soviet Union | 100.0 /100 | #40 | Exceptional 11.1% |
| Bhutanese | 100.0 /100 | #41 | Exceptional 11.2% |
| Chinese | 100.0 /100 | #42 | Exceptional 11.2% |
| Immigrants | Belarus | 100.0 /100 | #43 | Exceptional 11.2% |
| Immigrants | Western Asia | 100.0 /100 | #44 | Exceptional 11.2% |
| Turks | 100.0 /100 | #45 | Exceptional 11.2% |
| Laotians | 100.0 /100 | #46 | Exceptional 11.2% |
Demographics Similar to Creek by Divorced or Separated
In terms of divorced or separated, the demographic groups most similar to Creek are Cuban (14.5%, a difference of 0.68%), Kiowa (14.5%, a difference of 0.77%), Seminole (14.3%, a difference of 1.1%), Bahamian (14.2%, a difference of 1.2%), and Chickasaw (14.2%, a difference of 1.4%).
| Demographics | Rating | Rank | Divorced or Separated |
| Puerto Ricans | 0.0 /100 | #333 | Tragic 13.9% |
| Immigrants | Bahamas | 0.0 /100 | #334 | Tragic 13.9% |
| Dutch West Indians | 0.0 /100 | #335 | Tragic 14.0% |
| Shoshone | 0.0 /100 | #336 | Tragic 14.0% |
| Crow | 0.0 /100 | #337 | Tragic 14.1% |
| Choctaw | 0.0 /100 | #338 | Tragic 14.1% |
| Colville | 0.0 /100 | #339 | Tragic 14.2% |
| Chickasaw | 0.0 /100 | #340 | Tragic 14.2% |
| Bahamians | 0.0 /100 | #341 | Tragic 14.2% |
| Seminole | 0.0 /100 | #342 | Tragic 14.3% |
| Creek | 0.0 /100 | #343 | Tragic 14.4% |
| Cubans | 0.0 /100 | #344 | Tragic 14.5% |
| Kiowa | 0.0 /100 | #345 | Tragic 14.5% |
| Arapaho | 0.0 /100 | #346 | Tragic 14.8% |
| Immigrants | Cuba | 0.0 /100 | #347 | Tragic 15.2% |