Immigrants from Costa Rica vs Ugandan Family Households

COMPARE

Immigrants from Costa Rica
Race
Ancestry
AfghanAfricanAlaska NativeAlaskan AthabascanAlbanianAleutAlsatianAmericanApacheArabArapahoArgentineanArmenianAssyrian/Chaldean/SyriacAustralianAustrianBahamianBangladeshiBarbadianBasqueBelgianBelizeanBermudanBhutaneseBlackfeetBolivianBrazilianBritishBritish West IndianBulgarianBurmeseCajunCambodianCanadianCape VerdeanCarpatho RusynCelticCentral AmericanCentral American IndianCherokeeCheyenneChickasawChileanChineseChippewaChoctawColombianColvilleComancheCosta RicanCreeCreekCroatianCrowCubanCypriotCzechCzechoslovakianDanishDelawareDominicanDutchDutch West IndianEastern EuropeanEcuadorianEgyptianEnglishEstonianEthiopianEuropeanFijianFilipinoFinnishFrenchFrench American IndianFrench CanadianGermanGerman RussianGhanaianGreekGuamanian/ChamorroGuatemalanGuyaneseHaitianHmongHonduranHopiHoumaHungarianIcelanderIndian (Asian)IndonesianInupiatIranianIraqiIrishIroquoisIsraeliItalianJamaicanJapaneseJordanianKenyanKiowaKoreanLaotianLatvianLebaneseLiberianLithuanianLumbeeLuxembourgerMacedonianMalaysianMalteseMarshalleseMenomineeMexicanMexican American IndianMongolianMoroccanNative HawaiianNavajoNepaleseNew ZealanderNicaraguanNigerianNorthern EuropeanNorwegianOkinawanOsageOttawaPaiutePakistaniPalestinianPanamanianParaguayanPennsylvania GermanPeruvianPimaPolishPortuguesePotawatomiPuebloPuerto RicanPuget Sound SalishRomanianRussianSalvadoranSamoanScandinavianScotch-IrishScottishSeminoleSenegaleseSerbianShoshoneSierra LeoneanSiouxSlavicSlovakSloveneSomaliSouth AfricanSouth AmericanSouth American IndianSoviet UnionSpaniardSpanishSpanish AmericanSpanish American IndianSri LankanSubsaharan AfricanSudaneseSwedishSwissSyrianTaiwaneseThaiTlingit-HaidaTohono O'OdhamTonganTrinidadian and TobagonianTsimshianTurkishU.S. Virgin IslanderUkrainianUruguayanUteVenezuelanVietnameseWelshWest IndianYakamaYaquiYugoslavianYumanYup'ikZimbabwean
Immigration
NonimmigrantsImmigrantsAfghanistanAfricaAlbaniaArgentinaArmeniaAsiaAustraliaAustriaBahamasBangladeshBarbadosBelarusBelgiumBelizeBoliviaBosnia and HerzegovinaBrazilBulgariaBurma/MyanmarCabo VerdeCambodiaCameroonCanadaCaribbeanCentral AmericaChileChinaColombiaCongoCosta RicaCroatiaCubaCzechoslovakiaDenmarkDominicaDominican RepublicEastern AfricaEastern AsiaEastern EuropeEcuadorEgyptEl SalvadorEnglandEritreaEthiopiaEuropeFijiFranceGermanyGhanaGreeceGrenadaGuatemalaGuyanaHaitiHondurasHong KongHungaryIndiaIndonesiaIranIraqIrelandIsraelItalyJamaicaJapanJordanKazakhstanKenyaKoreaKuwaitLaosLatin AmericaLatviaLebanonLiberiaLithuaniaMalaysiaMexicoMicronesiaMiddle AfricaMoldovaMoroccoNepalNetherlandsNicaraguaNigeriaNorth AmericaNorth MacedoniaNorthern AfricaNorthern EuropeNorwayOceaniaPakistanPanamaPeruPhilippinesPolandPortugalRomaniaRussiaSaudi ArabiaScotlandSenegalSerbiaSierra LeoneSingaporeSomaliaSouth AfricaSouth AmericaSouth Central AsiaSouth Eastern AsiaSouthern EuropeSpainSri LankaSt. Vincent and the GrenadinesSudanSwedenSwitzerlandSyriaTaiwanThailandTrinidad and TobagoTurkeyUgandaUkraineUruguayUzbekistanVenezuelaVietnamWest IndiesWestern AfricaWestern AsiaWestern EuropeYemenZaireZimbabweAzores
Ugandan
Race
Ancestry
AfghanAfricanAlaska NativeAlaskan AthabascanAlbanianAleutAlsatianAmericanApacheArabArapahoArgentineanArmenianAssyrian/Chaldean/SyriacAustralianAustrianBahamianBangladeshiBarbadianBasqueBelgianBelizeanBermudanBhutaneseBlackfeetBolivianBrazilianBritishBritish West IndianBulgarianBurmeseCajunCambodianCanadianCape VerdeanCarpatho RusynCelticCentral AmericanCentral American IndianCherokeeCheyenneChickasawChileanChineseChippewaChoctawColombianColvilleComancheCosta RicanCreeCreekCroatianCrowCubanCypriotCzechCzechoslovakianDanishDelawareDominicanDutchDutch West IndianEastern EuropeanEcuadorianEgyptianEnglishEstonianEthiopianEuropeanFijianFilipinoFinnishFrenchFrench American IndianFrench CanadianGermanGerman RussianGhanaianGreekGuamanian/ChamorroGuatemalanGuyaneseHaitianHmongHonduranHopiHoumaHungarianIcelanderIndian (Asian)IndonesianInupiatIranianIraqiIrishIroquoisIsraeliItalianJamaicanJapaneseJordanianKenyanKiowaKoreanLaotianLatvianLebaneseLiberianLithuanianLumbeeLuxembourgerMacedonianMalaysianMalteseMarshalleseMenomineeMexicanMexican American IndianMongolianMoroccanNative HawaiianNavajoNepaleseNew ZealanderNicaraguanNigerianNorthern EuropeanNorwegianOkinawanOsageOttawaPaiutePakistaniPalestinianPanamanianParaguayanPennsylvania GermanPeruvianPimaPolishPortuguesePotawatomiPuebloPuerto RicanPuget Sound SalishRomanianRussianSalvadoranSamoanScandinavianScotch-IrishScottishSeminoleSenegaleseSerbianShoshoneSierra LeoneanSiouxSlavicSlovakSloveneSomaliSouth AfricanSouth AmericanSouth American IndianSoviet UnionSpaniardSpanishSpanish AmericanSpanish American IndianSri LankanSubsaharan AfricanSudaneseSwedishSwissSyrianTaiwaneseThaiTlingit-HaidaTohono O'OdhamTonganTrinidadian and TobagonianTsimshianTurkishU.S. Virgin IslanderUgandanUkrainianUruguayanUteVenezuelanVietnameseWelshWest IndianYakamaYaquiYugoslavianYumanYup'ikZimbabwean
Immigration
NonimmigrantsImmigrantsAfghanistanAfricaAlbaniaArgentinaArmeniaAsiaAustraliaAustriaBahamasBangladeshBarbadosBelarusBelgiumBelizeBoliviaBosnia and HerzegovinaBrazilBulgariaBurma/MyanmarCabo VerdeCambodiaCameroonCanadaCaribbeanCentral AmericaChileChinaColombiaCongoCroatiaCubaCzechoslovakiaDenmarkDominicaDominican RepublicEastern AfricaEastern AsiaEastern EuropeEcuadorEgyptEl SalvadorEnglandEritreaEthiopiaEuropeFijiFranceGermanyGhanaGreeceGrenadaGuatemalaGuyanaHaitiHondurasHong KongHungaryIndiaIndonesiaIranIraqIrelandIsraelItalyJamaicaJapanJordanKazakhstanKenyaKoreaKuwaitLaosLatin AmericaLatviaLebanonLiberiaLithuaniaMalaysiaMexicoMicronesiaMiddle AfricaMoldovaMoroccoNepalNetherlandsNicaraguaNigeriaNorth AmericaNorth MacedoniaNorthern AfricaNorthern EuropeNorwayOceaniaPakistanPanamaPeruPhilippinesPolandPortugalRomaniaRussiaSaudi ArabiaScotlandSenegalSerbiaSierra LeoneSingaporeSomaliaSouth AfricaSouth AmericaSouth Central AsiaSouth Eastern AsiaSouthern EuropeSpainSri LankaSt. Vincent and the GrenadinesSudanSwedenSwitzerlandSyriaTaiwanThailandTrinidad and TobagoTurkeyUgandaUkraineUruguayUzbekistanVenezuelaVietnamWest IndiesWestern AfricaWestern AsiaWestern EuropeYemenZaireZimbabweAzores
Family Households
Income
Poverty
Unemployment
Labor Participation
Family Structure
Vehicle Availability
Education Level
Disability

Family Households Comparison

Immigrants from Costa Rica

Ugandans

Exceptional
Tragic
65.6%
FAMILY HOUSEHOLDS
99.8/ 100
METRIC RATING
79th/ 347
METRIC RANK
61.7%
FAMILY HOUSEHOLDS
0.0/ 100
METRIC RATING
320th/ 347
METRIC RANK

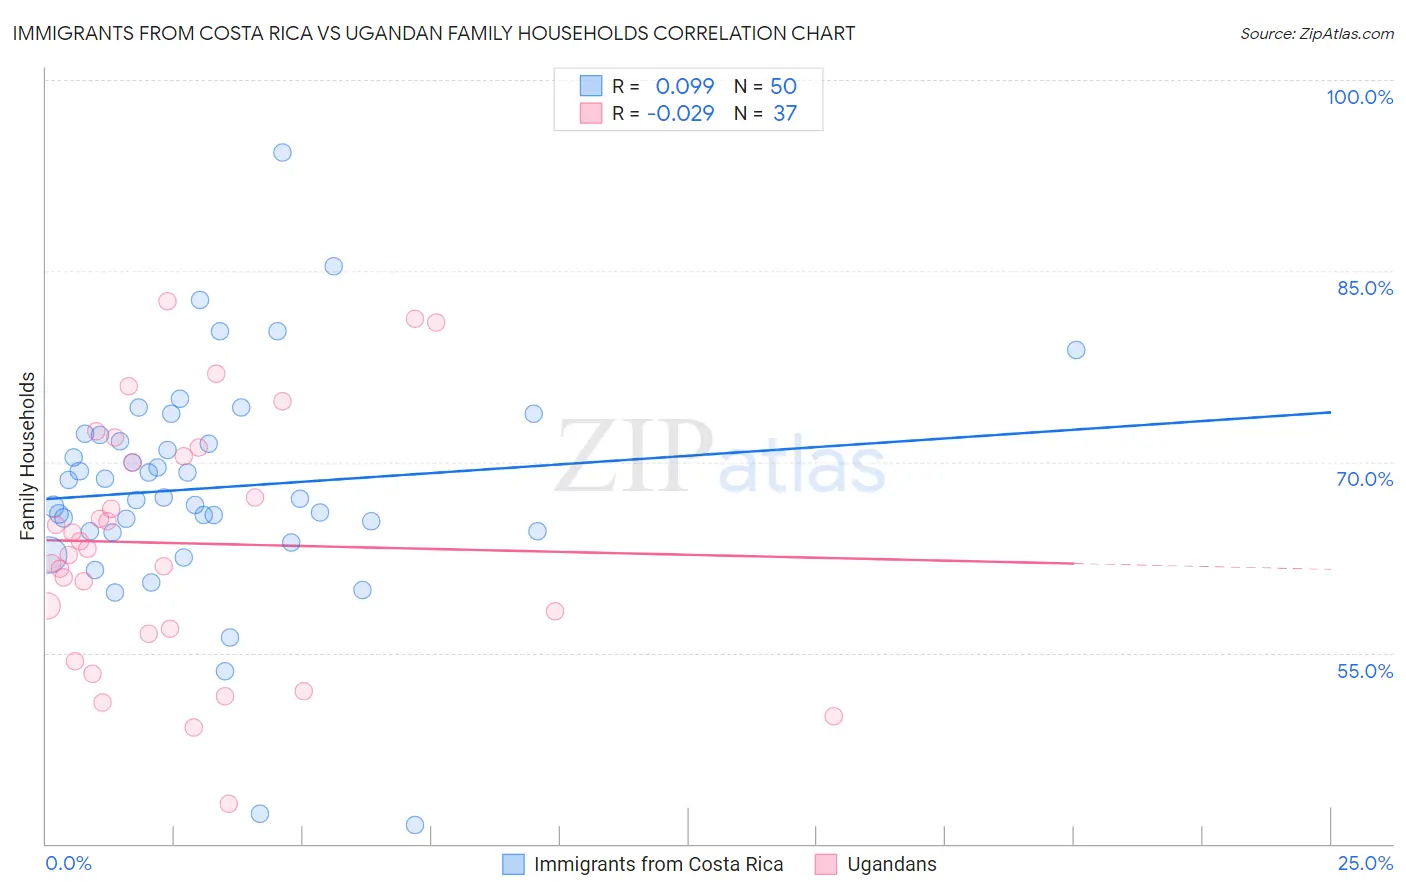
Immigrants from Costa Rica vs Ugandan Family Households Correlation Chart

The statistical analysis conducted on geographies consisting of 204,251,073 people shows a slight positive correlation between the proportion of Immigrants from Costa Rica and percentage of family households in the United States with a correlation coefficient (R) of 0.099 and weighted average of 65.6%. Similarly, the statistical analysis conducted on geographies consisting of 93,998,948 people shows no correlation between the proportion of Ugandans and percentage of family households in the United States with a correlation coefficient (R) of -0.029 and weighted average of 61.7%, a difference of 6.3%.
Immigrants from Costa Rica vs Ugandan Family Households

Family Households Correlation Summary

MeasurementImmigrants from Costa RicaUgandan
Minimum41.4%43.1%
Maximum94.4%82.6%
Range52.9%39.5%
Mean68.0%63.6%
Median67.1%63.1%
Interquartile 25% (IQ1)64.6%56.7%
Interquartile 75% (IQ3)72.1%70.8%
Interquartile Range (IQR)7.5%14.1%
Standard Deviation (Sample)9.0%9.7%
Standard Deviation (Population)9.0%9.5%

Similar Demographics by Family Households

Demographics Similar to Immigrants from Costa Rica by Family Households

In terms of family households, the demographic groups most similar to Immigrants from Costa Rica are Puget Sound Salish (65.6%, a difference of 0.010%), Yaqui (65.6%, a difference of 0.030%), Immigrants from the Azores (65.6%, a difference of 0.040%), Immigrants from South America (65.6%, a difference of 0.040%), and Jordanian (65.5%, a difference of 0.10%).
DemographicsRating | RankFamily Households
Portuguese
99.9
/100
|
#72
Exceptional
65.8%
Laotians
99.9
/100
|
#73
Exceptional
65.8%
Burmese
99.9
/100
|
#74
Exceptional
65.7%
Houma
99.9
/100
|
#75
Exceptional
65.7%
Immigrants | Azores
99.8
/100
|
#76
Exceptional
65.6%
Immigrants | South America
99.8
/100
|
#77
Exceptional
65.6%
Yaqui
99.8
/100
|
#78
Exceptional
65.6%
Immigrants | Costa Rica
99.8
/100
|
#79
Exceptional
65.6%
Puget Sound Salish
99.8
/100
|
#80
Exceptional
65.6%
Jordanians
99.7
/100
|
#81
Exceptional
65.5%
Immigrants | Lebanon
99.7
/100
|
#82
Exceptional
65.5%
Immigrants | Guyana
99.6
/100
|
#83
Exceptional
65.5%
Americans
99.6
/100
|
#84
Exceptional
65.5%
Immigrants | Cambodia
99.5
/100
|
#85
Exceptional
65.4%
Egyptians
99.4
/100
|
#86
Exceptional
65.4%

Demographics Similar to Ugandans by Family Households

In terms of family households, the demographic groups most similar to Ugandans are Alsatian (61.7%, a difference of 0.050%), Cape Verdean (61.8%, a difference of 0.12%), Immigrants from Serbia (61.6%, a difference of 0.14%), Tlingit-Haida (61.6%, a difference of 0.15%), and Immigrants from West Indies (61.6%, a difference of 0.16%).
DemographicsRating | RankFamily Households
Liberians
0.0
/100
|
#313
Tragic
62.0%
Immigrants | Cabo Verde
0.0
/100
|
#314
Tragic
61.9%
Moroccans
0.0
/100
|
#315
Tragic
61.9%
Immigrants | Middle Africa
0.0
/100
|
#316
Tragic
61.9%
Immigrants | Bosnia and Herzegovina
0.0
/100
|
#317
Tragic
61.9%
Alaskan Athabascans
0.0
/100
|
#318
Tragic
61.8%
Cape Verdeans
0.0
/100
|
#319
Tragic
61.8%
Ugandans
0.0
/100
|
#320
Tragic
61.7%
Alsatians
0.0
/100
|
#321
Tragic
61.7%
Immigrants | Serbia
0.0
/100
|
#322
Tragic
61.6%
Tlingit-Haida
0.0
/100
|
#323
Tragic
61.6%
Immigrants | West Indies
0.0
/100
|
#324
Tragic
61.6%
Immigrants | Switzerland
0.0
/100
|
#325
Tragic
61.6%
Indonesians
0.0
/100
|
#326
Tragic
61.5%
Blacks/African Americans
0.0
/100
|
#327
Tragic
61.5%