Immigrants from Congo vs Alaskan Athabascan Births to Unmarried Women
COMPARE
Immigrants from Congo
Alaskan Athabascan
Births to Unmarried Women
Births to Unmarried Women Comparison
Immigrants from Congo
Alaskan Athabascans
36.8%
BIRTHS TO UNMARRIED WOMEN
0.1/ 100
METRIC RATING
270th/ 347
METRIC RANK
37.7%
BIRTHS TO UNMARRIED WOMEN
0.0/ 100
METRIC RATING
289th/ 347
METRIC RANK
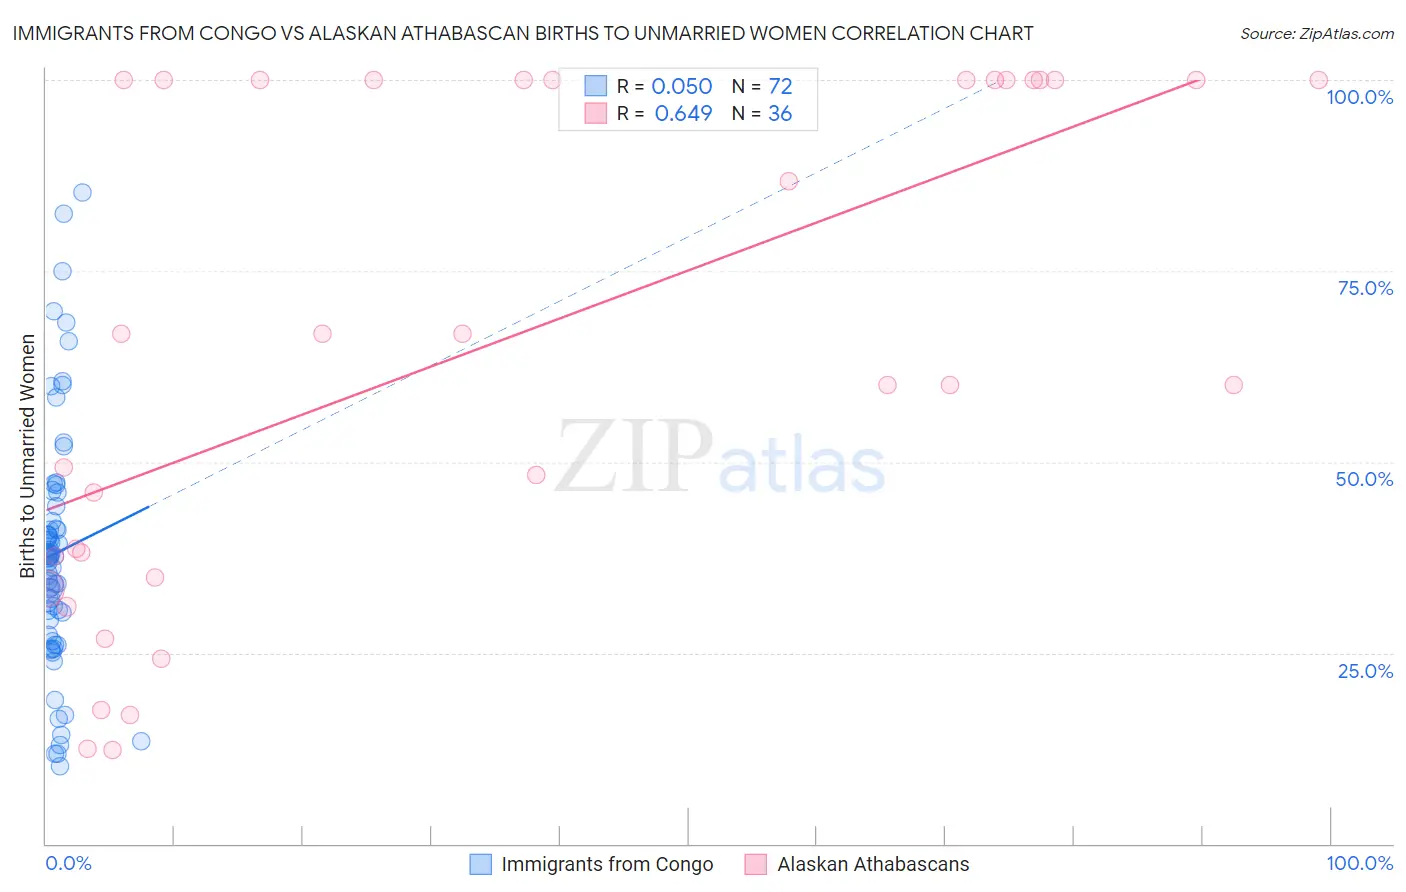
Immigrants from Congo vs Alaskan Athabascan Births to Unmarried Women Correlation Chart
The statistical analysis conducted on geographies consisting of 91,138,649 people shows no correlation between the proportion of Immigrants from Congo and percentage of births to unmarried women in the United States with a correlation coefficient (R) of 0.050 and weighted average of 36.8%. Similarly, the statistical analysis conducted on geographies consisting of 44,775,598 people shows a significant positive correlation between the proportion of Alaskan Athabascans and percentage of births to unmarried women in the United States with a correlation coefficient (R) of 0.649 and weighted average of 37.7%, a difference of 2.5%.
Births to Unmarried Women Correlation Summary
| Measurement | Immigrants from Congo | Alaskan Athabascan |
| Minimum | 10.2% | 12.2% |
| Maximum | 85.3% | 100.0% |
| Range | 75.1% | 87.8% |
| Mean | 38.0% | 64.8% |
| Median | 37.5% | 63.4% |
| Interquartile 25% (IQ1) | 28.3% | 36.2% |
| Interquartile 75% (IQ3) | 43.2% | 100.0% |
| Interquartile Range (IQR) | 14.9% | 63.8% |
| Standard Deviation (Sample) | 16.0% | 32.5% |
| Standard Deviation (Population) | 15.9% | 32.1% |
Demographics Similar to Immigrants from Congo and Alaskan Athabascans by Births to Unmarried Women
In terms of births to unmarried women, the demographic groups most similar to Immigrants from Congo are Immigrants from Barbados (36.8%, a difference of 0.030%), Senegalese (36.8%, a difference of 0.080%), Choctaw (36.9%, a difference of 0.24%), Mexican (36.9%, a difference of 0.36%), and Cree (37.0%, a difference of 0.45%). Similarly, the demographic groups most similar to Alaskan Athabascans are Immigrants from Liberia (37.6%, a difference of 0.23%), Creek (37.6%, a difference of 0.40%), Immigrants from Guatemala (37.5%, a difference of 0.63%), Immigrants from Mexico (37.5%, a difference of 0.65%), and Immigrants from Central America (37.4%, a difference of 0.75%).
| Demographics | Rating | Rank | Births to Unmarried Women |
| Senegalese | 0.1 /100 | #269 | Tragic 36.8% |
| Immigrants | Congo | 0.1 /100 | #270 | Tragic 36.8% |
| Immigrants | Barbados | 0.1 /100 | #271 | Tragic 36.8% |
| Choctaw | 0.1 /100 | #272 | Tragic 36.9% |
| Mexicans | 0.1 /100 | #273 | Tragic 36.9% |
| Cree | 0.1 /100 | #274 | Tragic 37.0% |
| Barbadians | 0.1 /100 | #275 | Tragic 37.0% |
| Belizeans | 0.1 /100 | #276 | Tragic 37.0% |
| Guatemalans | 0.1 /100 | #277 | Tragic 37.1% |
| Immigrants | Latin America | 0.1 /100 | #278 | Tragic 37.1% |
| West Indians | 0.1 /100 | #279 | Tragic 37.3% |
| Immigrants | St. Vincent and the Grenadines | 0.1 /100 | #280 | Tragic 37.3% |
| Immigrants | Belize | 0.1 /100 | #281 | Tragic 37.3% |
| Liberians | 0.0 /100 | #282 | Tragic 37.4% |
| Spanish American Indians | 0.0 /100 | #283 | Tragic 37.4% |
| Immigrants | Central America | 0.0 /100 | #284 | Tragic 37.4% |
| Immigrants | Mexico | 0.0 /100 | #285 | Tragic 37.5% |
| Immigrants | Guatemala | 0.0 /100 | #286 | Tragic 37.5% |
| Creek | 0.0 /100 | #287 | Tragic 37.6% |
| Immigrants | Liberia | 0.0 /100 | #288 | Tragic 37.6% |
| Alaskan Athabascans | 0.0 /100 | #289 | Tragic 37.7% |