French American Indian vs Alaskan Athabascan Births to Unmarried Women

COMPARE

French American Indian
Race
Ancestry
AfghanAfricanAlaska NativeAlbanianAleutAlsatianAmericanApacheArabArapahoArgentineanArmenianAssyrian/Chaldean/SyriacAustralianAustrianBahamianBangladeshiBarbadianBasqueBelgianBelizeanBermudanBhutaneseBlackfeetBolivianBrazilianBritishBritish West IndianBulgarianBurmeseCajunCambodianCanadianCape VerdeanCarpatho RusynCelticCentral AmericanCentral American IndianCherokeeCheyenneChickasawChileanChineseChippewaChoctawColombianColvilleComancheCosta RicanCreeCreekCroatianCrowCubanCypriotCzechCzechoslovakianDanishDelawareDominicanDutchDutch West IndianEastern EuropeanEcuadorianEgyptianEnglishEstonianEthiopianEuropeanFijianFilipinoFinnishFrenchFrench American IndianFrench CanadianGermanGerman RussianGhanaianGreekGuamanian/ChamorroGuatemalanGuyaneseHaitianHmongHonduranHopiHoumaHungarianIcelanderIndian (Asian)IndonesianInupiatIranianIraqiIrishIroquoisIsraeliItalianJamaicanJapaneseJordanianKenyanKiowaKoreanLaotianLatvianLebaneseLiberianLithuanianLumbeeLuxembourgerMacedonianMalaysianMalteseMarshalleseMenomineeMexicanMexican American IndianMongolianMoroccanNative HawaiianNavajoNepaleseNew ZealanderNicaraguanNigerianNorthern EuropeanNorwegianOkinawanOsageOttawaPaiutePakistaniPalestinianPanamanianParaguayanPennsylvania GermanPeruvianPimaPolishPortuguesePotawatomiPuebloPuerto RicanPuget Sound SalishRomanianRussianSalvadoranSamoanScandinavianScotch-IrishScottishSeminoleSenegaleseSerbianShoshoneSierra LeoneanSiouxSlavicSlovakSloveneSomaliSouth AfricanSouth AmericanSouth American IndianSoviet UnionSpaniardSpanishSpanish AmericanSpanish American IndianSri LankanSubsaharan AfricanSudaneseSwedishSwissSyrianTaiwaneseThaiTlingit-HaidaTohono O'OdhamTonganTrinidadian and TobagonianTsimshianTurkishU.S. Virgin IslanderUgandanUkrainianUruguayanUteVenezuelanVietnameseWelshWest IndianYakamaYaquiYugoslavianYumanYup'ikZimbabwean
Immigration
NonimmigrantsImmigrantsAfghanistanAfricaAlbaniaArgentinaArmeniaAsiaAustraliaAustriaBahamasBangladeshBarbadosBelarusBelgiumBelizeBoliviaBosnia and HerzegovinaBrazilBulgariaBurma/MyanmarCabo VerdeCambodiaCameroonCanadaCaribbeanCentral AmericaChileChinaColombiaCongoCosta RicaCroatiaCubaCzechoslovakiaDenmarkDominicaDominican RepublicEastern AfricaEastern AsiaEastern EuropeEcuadorEgyptEl SalvadorEnglandEritreaEthiopiaEuropeFijiFranceGermanyGhanaGreeceGrenadaGuatemalaGuyanaHaitiHondurasHong KongHungaryIndiaIndonesiaIranIraqIrelandIsraelItalyJamaicaJapanJordanKazakhstanKenyaKoreaKuwaitLaosLatin AmericaLatviaLebanonLiberiaLithuaniaMalaysiaMexicoMicronesiaMiddle AfricaMoldovaMoroccoNepalNetherlandsNicaraguaNigeriaNorth AmericaNorth MacedoniaNorthern AfricaNorthern EuropeNorwayOceaniaPakistanPanamaPeruPhilippinesPolandPortugalRomaniaRussiaSaudi ArabiaScotlandSenegalSerbiaSierra LeoneSingaporeSomaliaSouth AfricaSouth AmericaSouth Central AsiaSouth Eastern AsiaSouthern EuropeSpainSri LankaSt. Vincent and the GrenadinesSudanSwedenSwitzerlandSyriaTaiwanThailandTrinidad and TobagoTurkeyUgandaUkraineUruguayUzbekistanVenezuelaVietnamWest IndiesWestern AfricaWestern AsiaWestern EuropeYemenZaireZimbabweAzores
Alaskan Athabascan
Race
Ancestry
AfghanAfricanAlaska NativeAlaskan AthabascanAlbanianAleutAlsatianAmericanApacheArabArapahoArgentineanArmenianAssyrian/Chaldean/SyriacAustralianAustrianBahamianBangladeshiBarbadianBasqueBelgianBelizeanBermudanBhutaneseBlackfeetBolivianBrazilianBritishBritish West IndianBulgarianBurmeseCajunCambodianCanadianCape VerdeanCarpatho RusynCelticCentral AmericanCentral American IndianCherokeeCheyenneChickasawChileanChineseChippewaChoctawColombianColvilleComancheCosta RicanCreeCreekCroatianCrowCubanCypriotCzechCzechoslovakianDanishDelawareDominicanDutchDutch West IndianEastern EuropeanEcuadorianEgyptianEnglishEstonianEthiopianEuropeanFijianFilipinoFinnishFrenchFrench CanadianGermanGerman RussianGhanaianGreekGuamanian/ChamorroGuatemalanGuyaneseHaitianHmongHonduranHopiHoumaHungarianIcelanderIndian (Asian)IndonesianInupiatIranianIraqiIrishIroquoisIsraeliItalianJamaicanJapaneseJordanianKenyanKiowaKoreanLaotianLatvianLebaneseLiberianLithuanianLumbeeLuxembourgerMacedonianMalaysianMalteseMarshalleseMenomineeMexicanMexican American IndianMongolianMoroccanNative HawaiianNavajoNepaleseNew ZealanderNicaraguanNigerianNorthern EuropeanNorwegianOkinawanOsageOttawaPaiutePakistaniPalestinianPanamanianParaguayanPennsylvania GermanPeruvianPimaPolishPortuguesePotawatomiPuebloPuerto RicanPuget Sound SalishRomanianRussianSalvadoranSamoanScandinavianScotch-IrishScottishSeminoleSenegaleseSerbianShoshoneSierra LeoneanSiouxSlavicSlovakSloveneSomaliSouth AfricanSouth AmericanSouth American IndianSoviet UnionSpaniardSpanishSpanish AmericanSpanish American IndianSri LankanSubsaharan AfricanSudaneseSwedishSwissSyrianTaiwaneseThaiTlingit-HaidaTohono O'OdhamTonganTrinidadian and TobagonianTsimshianTurkishU.S. Virgin IslanderUgandanUkrainianUruguayanUteVenezuelanVietnameseWelshWest IndianYakamaYaquiYugoslavianYumanYup'ikZimbabwean
Immigration
NonimmigrantsImmigrantsAfghanistanAfricaAlbaniaArgentinaArmeniaAsiaAustraliaAustriaBahamasBangladeshBarbadosBelarusBelgiumBelizeBoliviaBosnia and HerzegovinaBrazilBulgariaBurma/MyanmarCabo VerdeCambodiaCameroonCanadaCaribbeanCentral AmericaChileChinaColombiaCongoCosta RicaCroatiaCubaCzechoslovakiaDenmarkDominicaDominican RepublicEastern AfricaEastern AsiaEastern EuropeEcuadorEgyptEl SalvadorEnglandEritreaEthiopiaEuropeFijiFranceGermanyGhanaGreeceGrenadaGuatemalaGuyanaHaitiHondurasHong KongHungaryIndiaIndonesiaIranIraqIrelandIsraelItalyJamaicaJapanJordanKazakhstanKenyaKoreaKuwaitLaosLatin AmericaLatviaLebanonLiberiaLithuaniaMalaysiaMexicoMicronesiaMiddle AfricaMoldovaMoroccoNepalNetherlandsNicaraguaNigeriaNorth AmericaNorth MacedoniaNorthern AfricaNorthern EuropeNorwayOceaniaPakistanPanamaPeruPhilippinesPolandPortugalRomaniaRussiaSaudi ArabiaScotlandSenegalSerbiaSierra LeoneSingaporeSomaliaSouth AfricaSouth AmericaSouth Central AsiaSouth Eastern AsiaSouthern EuropeSpainSri LankaSt. Vincent and the GrenadinesSudanSwedenSwitzerlandSyriaTaiwanThailandTrinidad and TobagoTurkeyUgandaUkraineUruguayUzbekistanVenezuelaVietnamWest IndiesWestern AfricaWestern AsiaWestern EuropeYemenZaireZimbabweAzores
Births to Unmarried Women
Income
Poverty
Unemployment
Labor Participation
Family Structure
Vehicle Availability
Education Level
Disability

Births to Unmarried Women Comparison

French American Indians

Alaskan Athabascans

Tragic
Tragic
36.6%
BIRTHS TO UNMARRIED WOMEN
0.1/ 100
METRIC RATING
262nd/ 347
METRIC RANK
37.7%
BIRTHS TO UNMARRIED WOMEN
0.0/ 100
METRIC RATING
289th/ 347
METRIC RANK

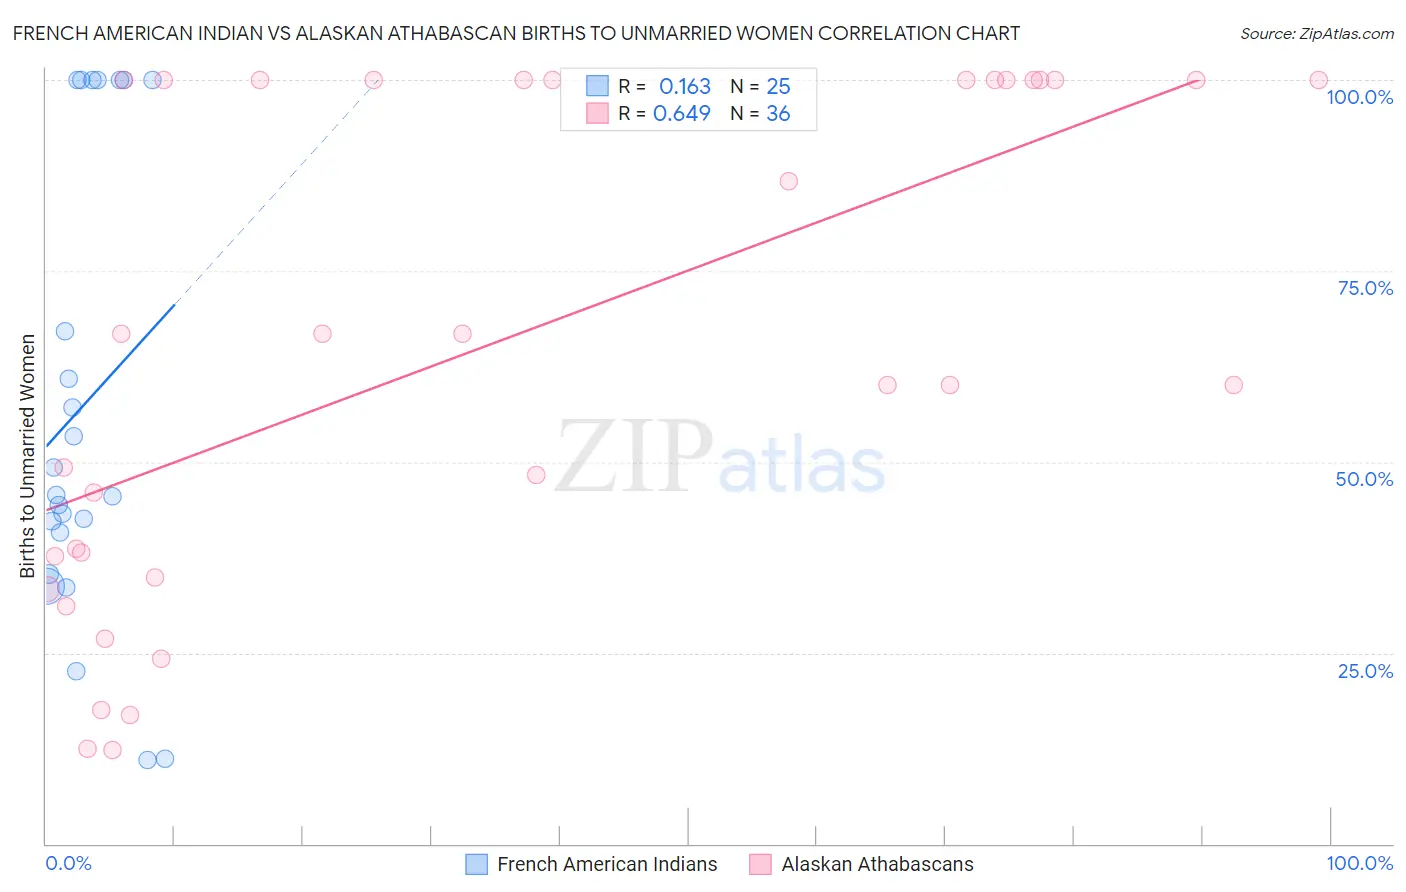
French American Indian vs Alaskan Athabascan Births to Unmarried Women Correlation Chart

The statistical analysis conducted on geographies consisting of 128,368,933 people shows a poor positive correlation between the proportion of French American Indians and percentage of births to unmarried women in the United States with a correlation coefficient (R) of 0.163 and weighted average of 36.6%. Similarly, the statistical analysis conducted on geographies consisting of 44,775,598 people shows a significant positive correlation between the proportion of Alaskan Athabascans and percentage of births to unmarried women in the United States with a correlation coefficient (R) of 0.649 and weighted average of 37.7%, a difference of 3.0%.
French American Indian vs Alaskan Athabascan Births to Unmarried Women

Births to Unmarried Women Correlation Summary

MeasurementFrench American IndianAlaskan Athabascan
Minimum10.9%12.2%
Maximum100.0%100.0%
Range89.1%87.8%
Mean57.6%64.8%
Median45.7%63.4%
Interquartile 25% (IQ1)38.0%36.2%
Interquartile 75% (IQ3)100.0%100.0%
Interquartile Range (IQR)62.0%63.8%
Standard Deviation (Sample)29.9%32.5%
Standard Deviation (Population)29.3%32.1%

Similar Demographics by Births to Unmarried Women

Demographics Similar to French American Indians by Births to Unmarried Women

In terms of births to unmarried women, the demographic groups most similar to French American Indians are Nicaraguan (36.6%, a difference of 0.020%), Subsaharan African (36.7%, a difference of 0.14%), Cherokee (36.7%, a difference of 0.19%), Immigrants from Senegal (36.7%, a difference of 0.24%), and Central American (36.7%, a difference of 0.31%).
DemographicsRating | RankBirths to Unmarried Women
Chickasaw
0.2
/100
|
#255
Tragic
36.3%
Immigrants | Trinidad and Tobago
0.2
/100
|
#256
Tragic
36.3%
Immigrants | Grenada
0.2
/100
|
#257
Tragic
36.3%
Americans
0.2
/100
|
#258
Tragic
36.4%
Immigrants | El Salvador
0.2
/100
|
#259
Tragic
36.4%
Ottawa
0.2
/100
|
#260
Tragic
36.5%
Trinidadians and Tobagonians
0.2
/100
|
#261
Tragic
36.5%
French American Indians
0.1
/100
|
#262
Tragic
36.6%
Nicaraguans
0.1
/100
|
#263
Tragic
36.6%
Sub-Saharan Africans
0.1
/100
|
#264
Tragic
36.7%
Cherokee
0.1
/100
|
#265
Tragic
36.7%
Immigrants | Senegal
0.1
/100
|
#266
Tragic
36.7%
Central Americans
0.1
/100
|
#267
Tragic
36.7%
Comanche
0.1
/100
|
#268
Tragic
36.7%
Senegalese
0.1
/100
|
#269
Tragic
36.8%

Demographics Similar to Alaskan Athabascans by Births to Unmarried Women

In terms of births to unmarried women, the demographic groups most similar to Alaskan Athabascans are Hispanic or Latino (37.8%, a difference of 0.14%), Immigrants from Liberia (37.6%, a difference of 0.23%), Creek (37.6%, a difference of 0.40%), Seminole (37.9%, a difference of 0.48%), and Blackfeet (37.9%, a difference of 0.52%).
DemographicsRating | RankBirths to Unmarried Women
Liberians
0.0
/100
|
#282
Tragic
37.4%
Spanish American Indians
0.0
/100
|
#283
Tragic
37.4%
Immigrants | Central America
0.0
/100
|
#284
Tragic
37.4%
Immigrants | Mexico
0.0
/100
|
#285
Tragic
37.5%
Immigrants | Guatemala
0.0
/100
|
#286
Tragic
37.5%
Creek
0.0
/100
|
#287
Tragic
37.6%
Immigrants | Liberia
0.0
/100
|
#288
Tragic
37.6%
Alaskan Athabascans
0.0
/100
|
#289
Tragic
37.7%
Hispanics or Latinos
0.0
/100
|
#290
Tragic
37.8%
Seminole
0.0
/100
|
#291
Tragic
37.9%
Blackfeet
0.0
/100
|
#292
Tragic
37.9%
Immigrants | Nicaragua
0.0
/100
|
#293
Tragic
38.0%
British West Indians
0.0
/100
|
#294
Tragic
38.0%
Iroquois
0.0
/100
|
#295
Tragic
38.2%
Alaska Natives
0.0
/100
|
#296
Tragic
38.3%