Immigrants from China vs Immigrants from Norway Family Households with Children

COMPARE

Immigrants from China
Race
Ancestry
AfghanAfricanAlaska NativeAlaskan AthabascanAlbanianAleutAlsatianAmericanApacheArabArapahoArgentineanArmenianAssyrian/Chaldean/SyriacAustralianAustrianBahamianBangladeshiBarbadianBasqueBelgianBelizeanBermudanBhutaneseBlackfeetBolivianBrazilianBritishBritish West IndianBulgarianBurmeseCajunCambodianCanadianCape VerdeanCarpatho RusynCelticCentral AmericanCentral American IndianCherokeeCheyenneChickasawChileanChineseChippewaChoctawColombianColvilleComancheCosta RicanCreeCreekCroatianCrowCubanCypriotCzechCzechoslovakianDanishDelawareDominicanDutchDutch West IndianEastern EuropeanEcuadorianEgyptianEnglishEstonianEthiopianEuropeanFijianFilipinoFinnishFrenchFrench American IndianFrench CanadianGermanGerman RussianGhanaianGreekGuamanian/ChamorroGuatemalanGuyaneseHaitianHmongHonduranHopiHoumaHungarianIcelanderIndian (Asian)IndonesianInupiatIranianIraqiIrishIroquoisIsraeliItalianJamaicanJapaneseJordanianKenyanKiowaKoreanLaotianLatvianLebaneseLiberianLithuanianLumbeeLuxembourgerMacedonianMalaysianMalteseMarshalleseMenomineeMexicanMexican American IndianMongolianMoroccanNative HawaiianNavajoNepaleseNew ZealanderNicaraguanNigerianNorthern EuropeanNorwegianOkinawanOsageOttawaPaiutePakistaniPalestinianPanamanianParaguayanPennsylvania GermanPeruvianPimaPolishPortuguesePotawatomiPuebloPuerto RicanPuget Sound SalishRomanianRussianSalvadoranSamoanScandinavianScotch-IrishScottishSeminoleSenegaleseSerbianShoshoneSierra LeoneanSiouxSlavicSlovakSloveneSomaliSouth AfricanSouth AmericanSouth American IndianSoviet UnionSpaniardSpanishSpanish AmericanSpanish American IndianSri LankanSubsaharan AfricanSudaneseSwedishSwissSyrianTaiwaneseThaiTlingit-HaidaTohono O'OdhamTonganTrinidadian and TobagonianTsimshianTurkishU.S. Virgin IslanderUgandanUkrainianUruguayanUteVenezuelanVietnameseWelshWest IndianYakamaYaquiYugoslavianYumanYup'ikZimbabwean
Immigration
NonimmigrantsImmigrantsAfghanistanAfricaAlbaniaArgentinaArmeniaAsiaAustraliaAustriaBahamasBangladeshBarbadosBelarusBelgiumBelizeBoliviaBosnia and HerzegovinaBrazilBulgariaBurma/MyanmarCabo VerdeCambodiaCameroonCanadaCaribbeanCentral AmericaChileChinaColombiaCongoCosta RicaCroatiaCubaCzechoslovakiaDenmarkDominicaDominican RepublicEastern AfricaEastern AsiaEastern EuropeEcuadorEgyptEl SalvadorEnglandEritreaEthiopiaEuropeFijiFranceGermanyGhanaGreeceGrenadaGuatemalaGuyanaHaitiHondurasHong KongHungaryIndiaIndonesiaIranIraqIrelandIsraelItalyJamaicaJapanJordanKazakhstanKenyaKoreaKuwaitLaosLatin AmericaLatviaLebanonLiberiaLithuaniaMalaysiaMexicoMicronesiaMiddle AfricaMoldovaMoroccoNepalNetherlandsNicaraguaNigeriaNorth AmericaNorth MacedoniaNorthern AfricaNorthern EuropeOceaniaPakistanPanamaPeruPhilippinesPolandPortugalRomaniaRussiaSaudi ArabiaScotlandSenegalSerbiaSierra LeoneSingaporeSomaliaSouth AfricaSouth AmericaSouth Central AsiaSouth Eastern AsiaSouthern EuropeSpainSri LankaSt. Vincent and the GrenadinesSudanSwedenSwitzerlandSyriaTaiwanThailandTrinidad and TobagoTurkeyUgandaUkraineUruguayUzbekistanVenezuelaVietnamWest IndiesWestern AfricaWestern AsiaWestern EuropeYemenZaireZimbabweAzores
Immigrants from Norway
Race
Ancestry
AfghanAfricanAlaska NativeAlaskan AthabascanAlbanianAleutAlsatianAmericanApacheArabArapahoArgentineanArmenianAssyrian/Chaldean/SyriacAustralianAustrianBahamianBangladeshiBarbadianBasqueBelgianBelizeanBermudanBhutaneseBlackfeetBolivianBrazilianBritishBritish West IndianBulgarianBurmeseCajunCambodianCanadianCape VerdeanCarpatho RusynCelticCentral AmericanCentral American IndianCherokeeCheyenneChickasawChileanChineseChippewaChoctawColombianColvilleComancheCosta RicanCreeCreekCroatianCrowCubanCypriotCzechCzechoslovakianDanishDelawareDominicanDutchDutch West IndianEastern EuropeanEcuadorianEgyptianEnglishEstonianEthiopianEuropeanFijianFilipinoFinnishFrenchFrench American IndianFrench CanadianGermanGerman RussianGhanaianGreekGuamanian/ChamorroGuatemalanGuyaneseHaitianHmongHonduranHopiHoumaHungarianIcelanderIndian (Asian)IndonesianInupiatIranianIraqiIrishIroquoisIsraeliItalianJamaicanJapaneseJordanianKenyanKiowaKoreanLaotianLatvianLebaneseLiberianLithuanianLumbeeLuxembourgerMacedonianMalaysianMalteseMarshalleseMenomineeMexicanMexican American IndianMongolianMoroccanNative HawaiianNavajoNepaleseNew ZealanderNicaraguanNigerianNorthern EuropeanNorwegianOkinawanOsageOttawaPaiutePakistaniPalestinianPanamanianParaguayanPennsylvania GermanPeruvianPimaPolishPortuguesePotawatomiPuebloPuerto RicanPuget Sound SalishRomanianRussianSalvadoranSamoanScandinavianScotch-IrishScottishSeminoleSenegaleseSerbianShoshoneSierra LeoneanSiouxSlavicSlovakSloveneSomaliSouth AfricanSouth AmericanSouth American IndianSoviet UnionSpaniardSpanishSpanish AmericanSpanish American IndianSri LankanSubsaharan AfricanSudaneseSwedishSwissSyrianTaiwaneseThaiTlingit-HaidaTohono O'OdhamTonganTrinidadian and TobagonianTsimshianTurkishU.S. Virgin IslanderUgandanUkrainianUruguayanUteVenezuelanVietnameseWelshWest IndianYakamaYaquiYugoslavianYumanYup'ikZimbabwean
Immigration
NonimmigrantsImmigrantsAfghanistanAfricaAlbaniaArgentinaArmeniaAsiaAustraliaAustriaBahamasBangladeshBarbadosBelarusBelgiumBelizeBoliviaBosnia and HerzegovinaBrazilBulgariaBurma/MyanmarCabo VerdeCambodiaCameroonCanadaCaribbeanCentral AmericaChileColombiaCongoCosta RicaCroatiaCubaCzechoslovakiaDenmarkDominicaDominican RepublicEastern AfricaEastern AsiaEastern EuropeEcuadorEgyptEl SalvadorEnglandEritreaEthiopiaEuropeFijiFranceGermanyGhanaGreeceGrenadaGuatemalaGuyanaHaitiHondurasHong KongHungaryIndiaIndonesiaIranIraqIrelandIsraelItalyJamaicaJapanJordanKazakhstanKenyaKoreaKuwaitLaosLatin AmericaLatviaLebanonLiberiaLithuaniaMalaysiaMexicoMicronesiaMiddle AfricaMoldovaMoroccoNepalNetherlandsNicaraguaNigeriaNorth AmericaNorth MacedoniaNorthern AfricaNorthern EuropeNorwayOceaniaPakistanPanamaPeruPhilippinesPolandPortugalRomaniaRussiaSaudi ArabiaScotlandSenegalSerbiaSierra LeoneSingaporeSomaliaSouth AfricaSouth AmericaSouth Central AsiaSouth Eastern AsiaSouthern EuropeSpainSri LankaSt. Vincent and the GrenadinesSudanSwedenSwitzerlandSyriaTaiwanThailandTrinidad and TobagoTurkeyUgandaUkraineUruguayUzbekistanVenezuelaVietnamWest IndiesWestern AfricaWestern AsiaWestern EuropeYemenZaireZimbabweAzores
Family Households with Children
Income
Poverty
Unemployment
Labor Participation
Family Structure
Vehicle Availability
Education Level
Disability

Family Households with Children Comparison

Immigrants from China

Immigrants from Norway

Average
Tragic
27.4%
FAMILY HOUSEHOLDS WITH CHILDREN
49.6/ 100
METRIC RATING
176th/ 347
METRIC RANK
26.1%
FAMILY HOUSEHOLDS WITH CHILDREN
0.0/ 100
METRIC RATING
315th/ 347
METRIC RANK

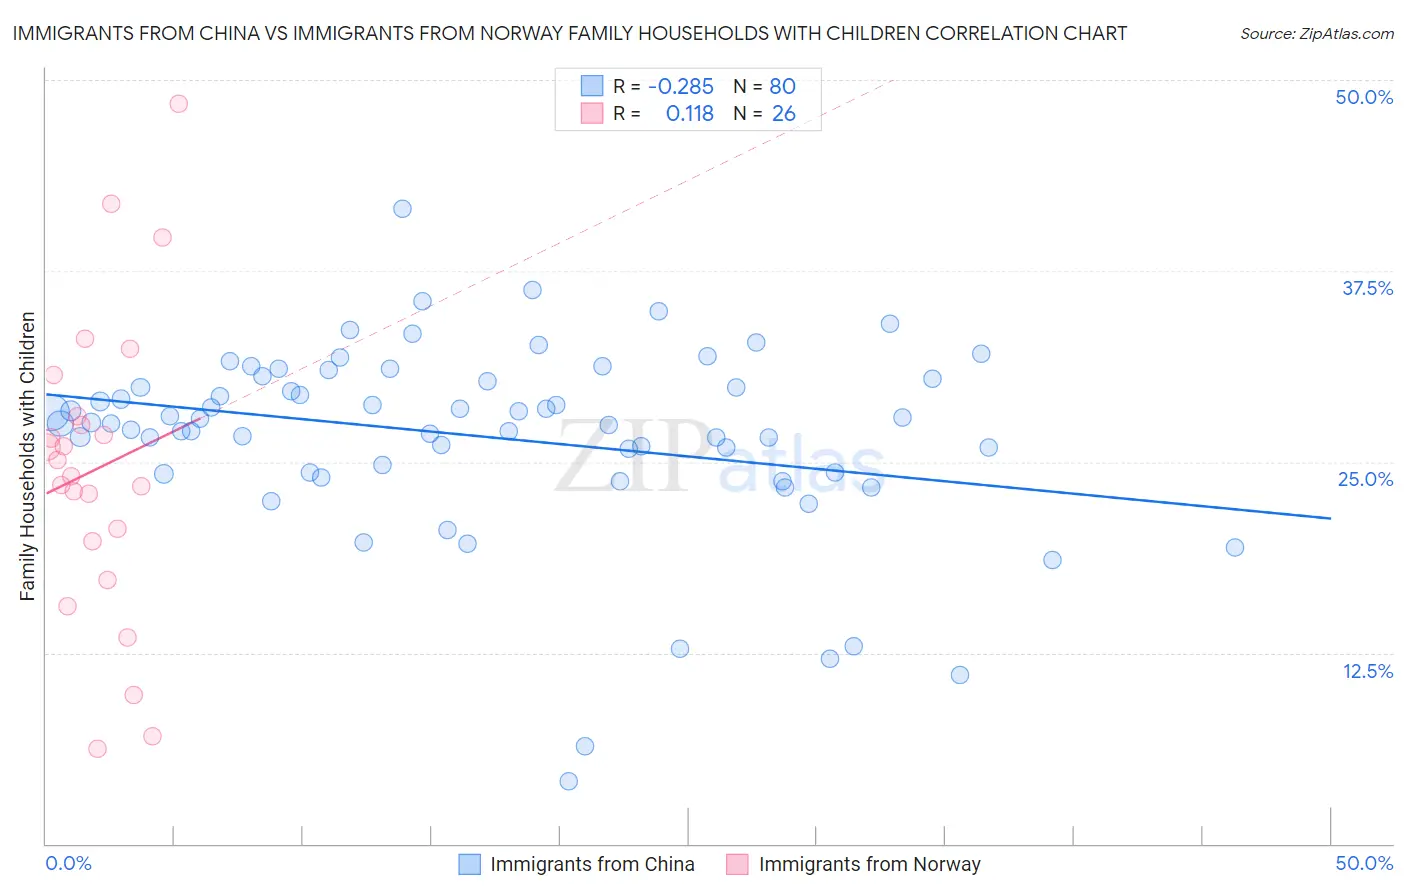
Immigrants from China vs Immigrants from Norway Family Households with Children Correlation Chart

The statistical analysis conducted on geographies consisting of 456,380,554 people shows a weak negative correlation between the proportion of Immigrants from China and percentage of family households with children in the United States with a correlation coefficient (R) of -0.285 and weighted average of 27.4%. Similarly, the statistical analysis conducted on geographies consisting of 116,684,213 people shows a poor positive correlation between the proportion of Immigrants from Norway and percentage of family households with children in the United States with a correlation coefficient (R) of 0.118 and weighted average of 26.1%, a difference of 5.1%.
Immigrants from China vs Immigrants from Norway Family Households with Children

Family Households with Children Correlation Summary

MeasurementImmigrants from ChinaImmigrants from Norway
Minimum4.1%6.2%
Maximum41.6%48.4%
Range37.5%42.2%
Mean26.7%24.6%
Median27.6%24.6%
Interquartile 25% (IQ1)24.3%19.8%
Interquartile 75% (IQ3)30.4%28.0%
Interquartile Range (IQR)6.1%8.1%
Standard Deviation (Sample)6.3%9.9%
Standard Deviation (Population)6.3%9.7%

Similar Demographics by Family Households with Children

Demographics Similar to Immigrants from China by Family Households with Children

In terms of family households with children, the demographic groups most similar to Immigrants from China are White/Caucasian (27.4%, a difference of 0.010%), British (27.4%, a difference of 0.010%), Ugandan (27.4%, a difference of 0.010%), Spanish American (27.4%, a difference of 0.020%), and Immigrants from Argentina (27.5%, a difference of 0.060%).
DemographicsRating | RankFamily Households with Children
Seminole
56.9
/100
|
#169
Average
27.5%
Cherokee
56.7
/100
|
#170
Average
27.5%
Blackfeet
54.3
/100
|
#171
Average
27.5%
Israelis
53.9
/100
|
#172
Average
27.5%
Immigrants | Argentina
52.2
/100
|
#173
Average
27.5%
Whites/Caucasians
50.0
/100
|
#174
Average
27.4%
British
49.9
/100
|
#175
Average
27.4%
Immigrants | China
49.6
/100
|
#176
Average
27.4%
Ugandans
49.2
/100
|
#177
Average
27.4%
Spanish Americans
48.9
/100
|
#178
Average
27.4%
Turks
46.9
/100
|
#179
Average
27.4%
Immigrants | Turkey
46.9
/100
|
#180
Average
27.4%
Aleuts
46.7
/100
|
#181
Average
27.4%
Puget Sound Salish
46.2
/100
|
#182
Average
27.4%
South Africans
44.9
/100
|
#183
Average
27.4%

Demographics Similar to Immigrants from Norway by Family Households with Children

In terms of family households with children, the demographic groups most similar to Immigrants from Norway are French Canadian (26.1%, a difference of 0.070%), Estonian (26.1%, a difference of 0.080%), Cree (26.2%, a difference of 0.15%), Ottawa (26.1%, a difference of 0.17%), and Iroquois (26.1%, a difference of 0.21%).
DemographicsRating | RankFamily Households with Children
Lumbee
0.0
/100
|
#308
Tragic
26.3%
Immigrants | Somalia
0.0
/100
|
#309
Tragic
26.3%
Marshallese
0.0
/100
|
#310
Tragic
26.2%
Colville
0.0
/100
|
#311
Tragic
26.2%
Immigrants | Czechoslovakia
0.0
/100
|
#312
Tragic
26.2%
Cree
0.0
/100
|
#313
Tragic
26.2%
French Canadians
0.0
/100
|
#314
Tragic
26.1%
Immigrants | Norway
0.0
/100
|
#315
Tragic
26.1%
Estonians
0.0
/100
|
#316
Tragic
26.1%
Ottawa
0.0
/100
|
#317
Tragic
26.1%
Iroquois
0.0
/100
|
#318
Tragic
26.1%
Immigrants | France
0.0
/100
|
#319
Tragic
26.0%
Tlingit-Haida
0.0
/100
|
#320
Tragic
26.0%
British West Indians
0.0
/100
|
#321
Tragic
26.0%
Immigrants | Greece
0.0
/100
|
#322
Tragic
26.0%