Immigrants from Cameroon vs Trinidadian and Tobagonian Divorced or Separated
COMPARE
Immigrants from Cameroon
Trinidadian and Tobagonian
Divorced or Separated
Divorced or Separated Comparison
Immigrants from Cameroon
Trinidadians and Tobagonians
12.3%
DIVORCED OR SEPARATED
8.3/ 100
METRIC RATING
228th/ 347
METRIC RANK
12.2%
DIVORCED OR SEPARATED
16.6/ 100
METRIC RATING
211th/ 347
METRIC RANK
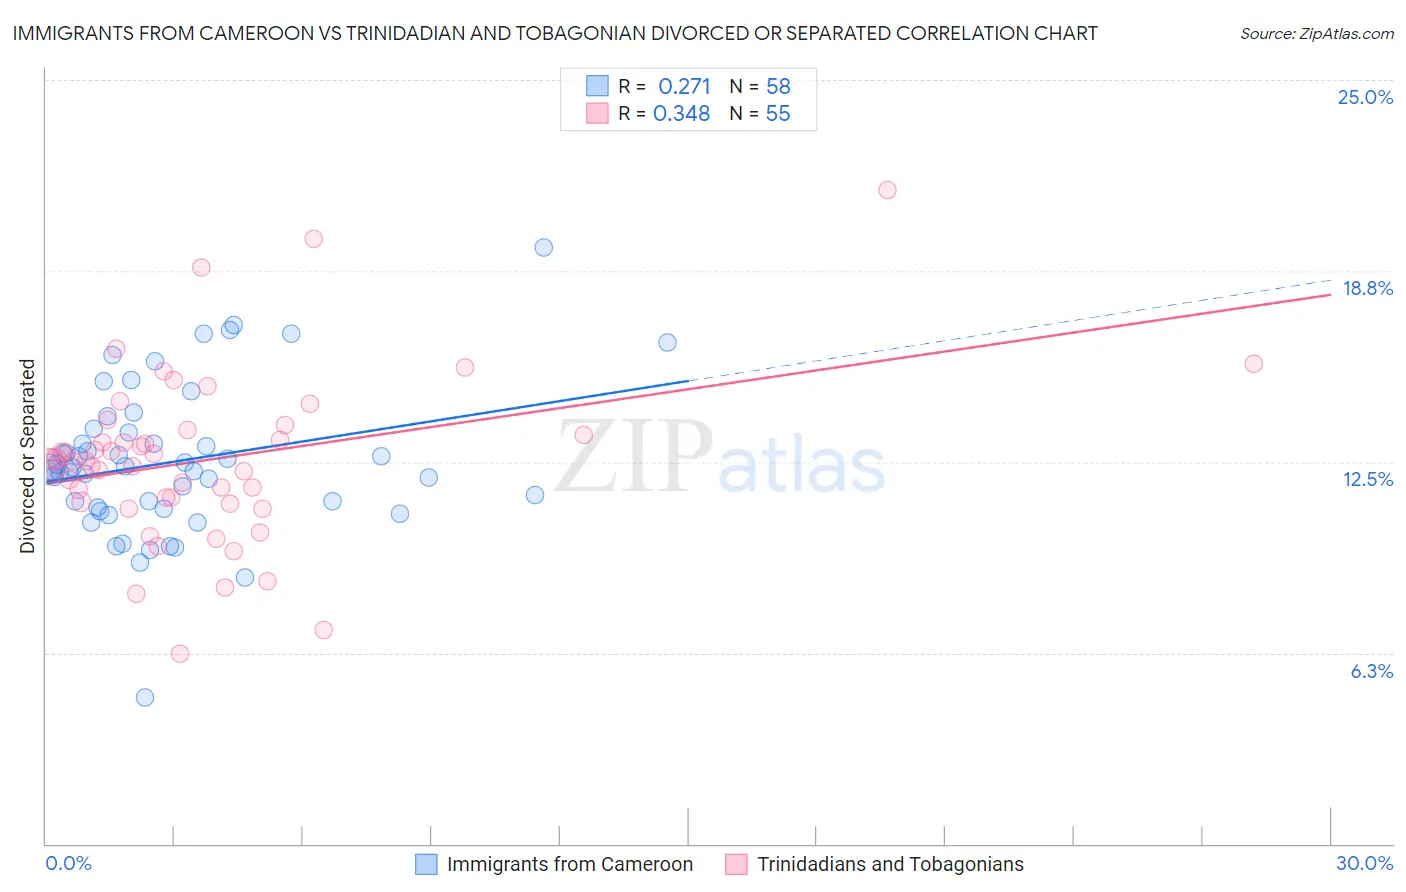
Immigrants from Cameroon vs Trinidadian and Tobagonian Divorced or Separated Correlation Chart
The statistical analysis conducted on geographies consisting of 130,744,662 people shows a weak positive correlation between the proportion of Immigrants from Cameroon and percentage of population currently divorced or separated in the United States with a correlation coefficient (R) of 0.271 and weighted average of 12.3%. Similarly, the statistical analysis conducted on geographies consisting of 219,763,096 people shows a mild positive correlation between the proportion of Trinidadians and Tobagonians and percentage of population currently divorced or separated in the United States with a correlation coefficient (R) of 0.348 and weighted average of 12.2%, a difference of 0.67%.
Divorced or Separated Correlation Summary
| Measurement | Immigrants from Cameroon | Trinidadian and Tobagonian |
| Minimum | 4.8% | 6.2% |
| Maximum | 19.5% | 21.4% |
| Range | 14.7% | 15.2% |
| Mean | 12.5% | 12.6% |
| Median | 12.3% | 12.5% |
| Interquartile 25% (IQ1) | 11.0% | 11.2% |
| Interquartile 75% (IQ3) | 13.5% | 13.5% |
| Interquartile Range (IQR) | 2.5% | 2.3% |
| Standard Deviation (Sample) | 2.4% | 2.8% |
| Standard Deviation (Population) | 2.4% | 2.7% |
Demographics Similar to Immigrants from Cameroon and Trinidadians and Tobagonians by Divorced or Separated
In terms of divorced or separated, the demographic groups most similar to Immigrants from Cameroon are Immigrants from Sudan (12.3%, a difference of 0.020%), Hmong (12.3%, a difference of 0.050%), Immigrants from Western Africa (12.3%, a difference of 0.10%), Immigrants from the Azores (12.3%, a difference of 0.14%), and Belgian (12.3%, a difference of 0.14%). Similarly, the demographic groups most similar to Trinidadians and Tobagonians are Immigrants from Kenya (12.2%, a difference of 0.010%), Slavic (12.2%, a difference of 0.020%), Immigrants from Eastern Africa (12.2%, a difference of 0.030%), Immigrants from Trinidad and Tobago (12.2%, a difference of 0.070%), and Immigrants from Argentina (12.2%, a difference of 0.070%).
| Demographics | Rating | Rank | Divorced or Separated |
| Immigrants | Trinidad and Tobago | 17.8 /100 | #209 | Poor 12.2% |
| Slavs | 17.0 /100 | #210 | Poor 12.2% |
| Trinidadians and Tobagonians | 16.6 /100 | #211 | Poor 12.2% |
| Immigrants | Kenya | 16.5 /100 | #212 | Poor 12.2% |
| Immigrants | Eastern Africa | 16.2 /100 | #213 | Poor 12.2% |
| Immigrants | Argentina | 15.5 /100 | #214 | Poor 12.2% |
| Europeans | 15.4 /100 | #215 | Poor 12.2% |
| Immigrants | South America | 15.4 /100 | #216 | Poor 12.2% |
| Northern Europeans | 14.7 /100 | #217 | Poor 12.2% |
| Slovenes | 13.2 /100 | #218 | Poor 12.3% |
| Czechoslovakians | 11.7 /100 | #219 | Poor 12.3% |
| British | 11.6 /100 | #220 | Poor 12.3% |
| Guamanians/Chamorros | 11.3 /100 | #221 | Poor 12.3% |
| Bangladeshis | 10.5 /100 | #222 | Poor 12.3% |
| Scandinavians | 10.4 /100 | #223 | Poor 12.3% |
| Immigrants | Azores | 9.7 /100 | #224 | Tragic 12.3% |
| Belgians | 9.7 /100 | #225 | Tragic 12.3% |
| Immigrants | Western Africa | 9.3 /100 | #226 | Tragic 12.3% |
| Hmong | 8.8 /100 | #227 | Tragic 12.3% |
| Immigrants | Cameroon | 8.3 /100 | #228 | Tragic 12.3% |
| Immigrants | Sudan | 8.2 /100 | #229 | Tragic 12.3% |