Immigrants from Cambodia vs Irish Single Mother Households
COMPARE
Immigrants from Cambodia
Irish
Single Mother Households
Single Mother Households Comparison
Immigrants from Cambodia
Irish
7.2%
SINGLE MOTHER HOUSEHOLDS
0.5/ 100
METRIC RATING
245th/ 347
METRIC RANK
5.8%
SINGLE MOTHER HOUSEHOLDS
94.8/ 100
METRIC RATING
115th/ 347
METRIC RANK
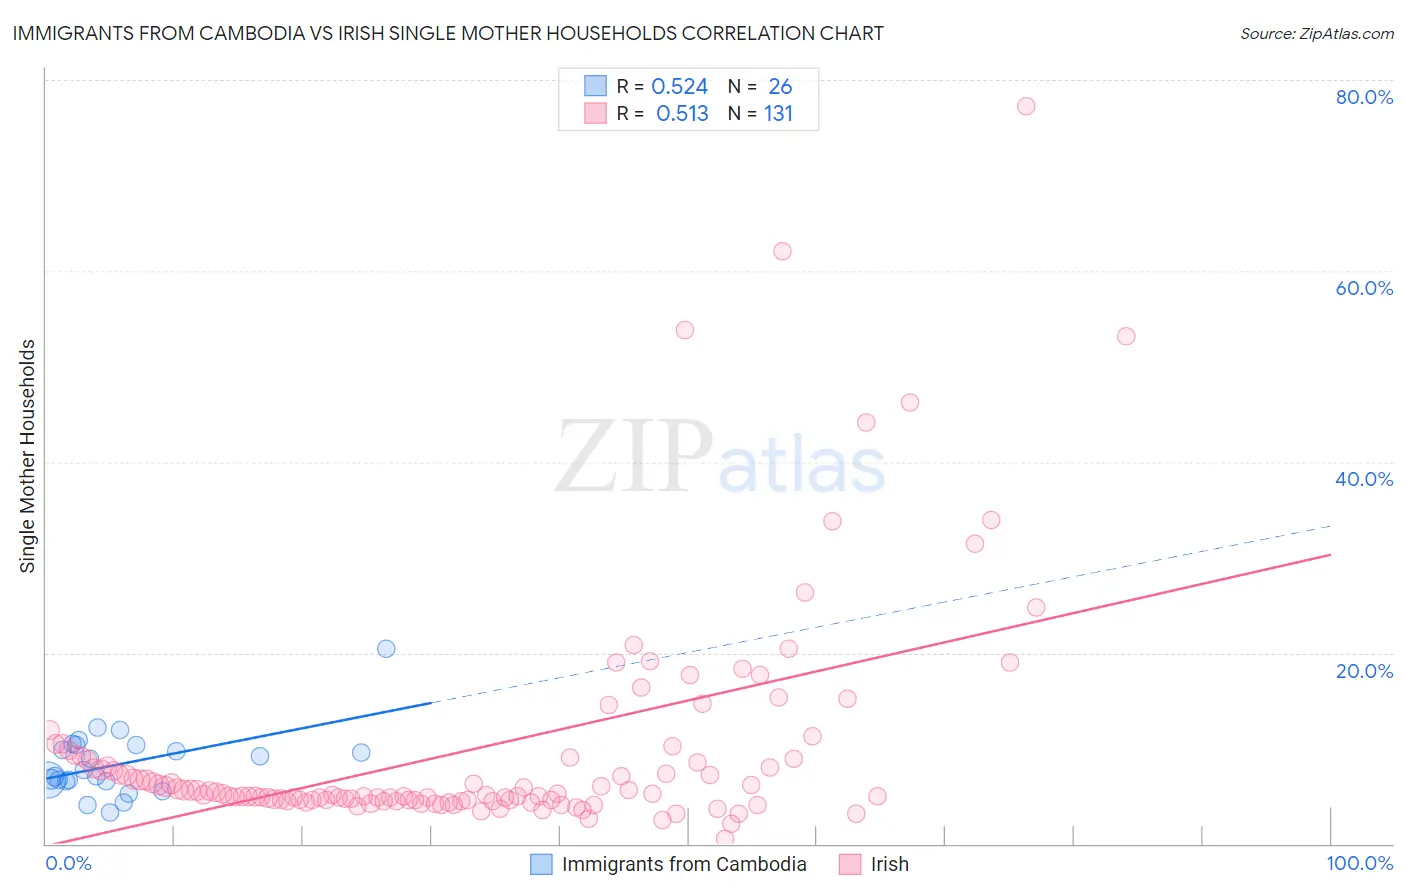
Immigrants from Cambodia vs Irish Single Mother Households Correlation Chart
The statistical analysis conducted on geographies consisting of 205,083,735 people shows a substantial positive correlation between the proportion of Immigrants from Cambodia and percentage of single mother households in the United States with a correlation coefficient (R) of 0.524 and weighted average of 7.2%. Similarly, the statistical analysis conducted on geographies consisting of 573,559,537 people shows a substantial positive correlation between the proportion of Irish and percentage of single mother households in the United States with a correlation coefficient (R) of 0.513 and weighted average of 5.8%, a difference of 24.4%.
Single Mother Households Correlation Summary
| Measurement | Immigrants from Cambodia | Irish |
| Minimum | 3.3% | 0.49% |
| Maximum | 20.4% | 77.3% |
| Range | 17.1% | 76.8% |
| Mean | 8.4% | 10.0% |
| Median | 7.4% | 5.2% |
| Interquartile 25% (IQ1) | 6.6% | 4.5% |
| Interquartile 75% (IQ3) | 10.3% | 9.0% |
| Interquartile Range (IQR) | 3.7% | 4.5% |
| Standard Deviation (Sample) | 3.4% | 12.1% |
| Standard Deviation (Population) | 3.4% | 12.0% |
Similar Demographics by Single Mother Households
Demographics Similar to Immigrants from Cambodia by Single Mother Households
In terms of single mother households, the demographic groups most similar to Immigrants from Cambodia are Nicaraguan (7.2%, a difference of 0.18%), Cuban (7.2%, a difference of 0.34%), Ecuadorian (7.2%, a difference of 0.41%), Dutch West Indian (7.3%, a difference of 0.43%), and Fijian (7.2%, a difference of 0.46%).
| Demographics | Rating | Rank | Single Mother Households |
| Panamanians | 0.9 /100 | #238 | Tragic 7.1% |
| Kiowa | 0.8 /100 | #239 | Tragic 7.1% |
| Immigrants | Panama | 0.7 /100 | #240 | Tragic 7.2% |
| Immigrants | Portugal | 0.6 /100 | #241 | Tragic 7.2% |
| Fijians | 0.6 /100 | #242 | Tragic 7.2% |
| Ecuadorians | 0.6 /100 | #243 | Tragic 7.2% |
| Cubans | 0.6 /100 | #244 | Tragic 7.2% |
| Immigrants | Cambodia | 0.5 /100 | #245 | Tragic 7.2% |
| Nicaraguans | 0.5 /100 | #246 | Tragic 7.2% |
| Dutch West Indians | 0.4 /100 | #247 | Tragic 7.3% |
| Spanish American Indians | 0.4 /100 | #248 | Tragic 7.3% |
| Bermudans | 0.4 /100 | #249 | Tragic 7.3% |
| Immigrants | Africa | 0.4 /100 | #250 | Tragic 7.3% |
| Malaysians | 0.3 /100 | #251 | Tragic 7.3% |
| Alaskan Athabascans | 0.3 /100 | #252 | Tragic 7.3% |
Demographics Similar to Irish by Single Mother Households
In terms of single mother households, the demographic groups most similar to Irish are Pennsylvania German (5.8%, a difference of 0.070%), Bolivian (5.8%, a difference of 0.14%), Dutch (5.8%, a difference of 0.19%), Mongolian (5.8%, a difference of 0.31%), and Laotian (5.8%, a difference of 0.32%).
| Demographics | Rating | Rank | Single Mother Households |
| Immigrants | Italy | 95.8 /100 | #108 | Exceptional 5.8% |
| Immigrants | Western Europe | 95.7 /100 | #109 | Exceptional 5.8% |
| British | 95.5 /100 | #110 | Exceptional 5.8% |
| Immigrants | England | 95.5 /100 | #111 | Exceptional 5.8% |
| Immigrants | Kuwait | 95.4 /100 | #112 | Exceptional 5.8% |
| Mongolians | 95.3 /100 | #113 | Exceptional 5.8% |
| Dutch | 95.1 /100 | #114 | Exceptional 5.8% |
| Irish | 94.8 /100 | #115 | Exceptional 5.8% |
| Pennsylvania Germans | 94.7 /100 | #116 | Exceptional 5.8% |
| Bolivians | 94.6 /100 | #117 | Exceptional 5.8% |
| Laotians | 94.3 /100 | #118 | Exceptional 5.8% |
| South Africans | 94.1 /100 | #119 | Exceptional 5.8% |
| Tongans | 93.7 /100 | #120 | Exceptional 5.8% |
| Argentineans | 93.7 /100 | #121 | Exceptional 5.8% |
| Belgians | 93.5 /100 | #122 | Exceptional 5.8% |