Immigrants from Bosnia and Herzegovina vs Immigrants from Scotland Family Households
COMPARE
Immigrants from Bosnia and Herzegovina
Immigrants from Scotland
Family Households
Family Households Comparison
Immigrants from Bosnia and Herzegovina
Immigrants from Scotland
61.9%
FAMILY HOUSEHOLDS
0.0/ 100
METRIC RATING
317th/ 347
METRIC RANK
64.7%
FAMILY HOUSEHOLDS
86.4/ 100
METRIC RATING
137th/ 347
METRIC RANK
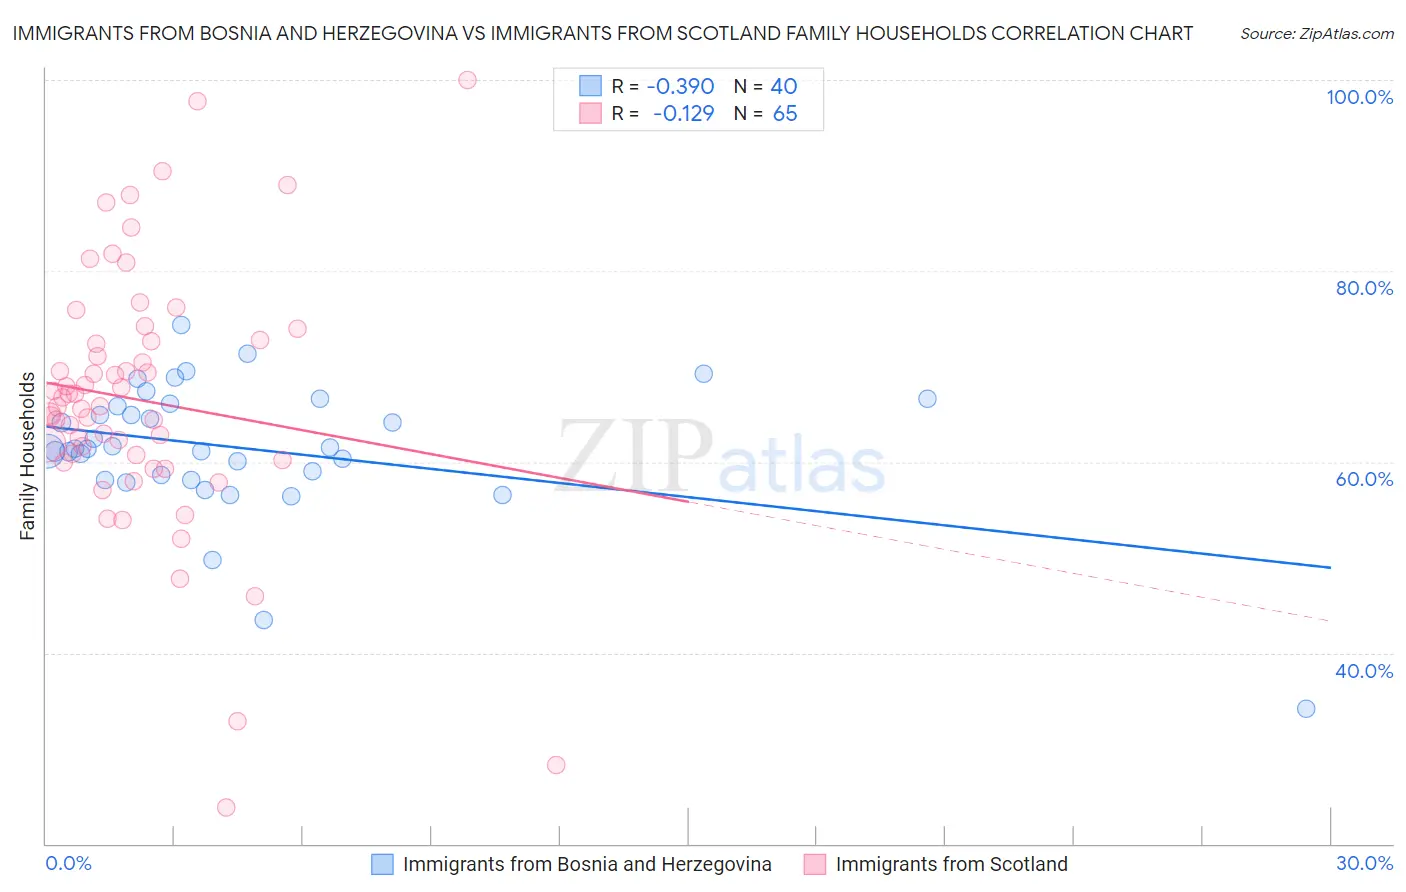
Immigrants from Bosnia and Herzegovina vs Immigrants from Scotland Family Households Correlation Chart
The statistical analysis conducted on geographies consisting of 156,805,510 people shows a mild negative correlation between the proportion of Immigrants from Bosnia and Herzegovina and percentage of family households in the United States with a correlation coefficient (R) of -0.390 and weighted average of 61.9%. Similarly, the statistical analysis conducted on geographies consisting of 196,383,501 people shows a poor negative correlation between the proportion of Immigrants from Scotland and percentage of family households in the United States with a correlation coefficient (R) of -0.129 and weighted average of 64.7%, a difference of 4.6%.
Family Households Correlation Summary
| Measurement | Immigrants from Bosnia and Herzegovina | Immigrants from Scotland |
| Minimum | 34.1% | 23.8% |
| Maximum | 74.3% | 100.0% |
| Range | 40.2% | 76.2% |
| Mean | 61.4% | 66.5% |
| Median | 61.4% | 65.8% |
| Interquartile 25% (IQ1) | 58.4% | 60.5% |
| Interquartile 75% (IQ3) | 65.9% | 72.7% |
| Interquartile Range (IQR) | 7.5% | 12.2% |
| Standard Deviation (Sample) | 7.2% | 13.8% |
| Standard Deviation (Population) | 7.1% | 13.7% |
Similar Demographics by Family Households
Demographics Similar to Immigrants from Bosnia and Herzegovina by Family Households
In terms of family households, the demographic groups most similar to Immigrants from Bosnia and Herzegovina are Immigrants from Middle Africa (61.9%, a difference of 0.040%), Moroccan (61.9%, a difference of 0.080%), Alaskan Athabascan (61.8%, a difference of 0.080%), Immigrants from Cabo Verde (61.9%, a difference of 0.13%), and Cape Verdean (61.8%, a difference of 0.14%).
| Demographics | Rating | Rank | Family Households |
| Immigrants | Liberia | 0.0 /100 | #310 | Tragic 62.0% |
| Immigrants | Morocco | 0.0 /100 | #311 | Tragic 62.0% |
| Immigrants | Latvia | 0.0 /100 | #312 | Tragic 62.0% |
| Liberians | 0.0 /100 | #313 | Tragic 62.0% |
| Immigrants | Cabo Verde | 0.0 /100 | #314 | Tragic 61.9% |
| Moroccans | 0.0 /100 | #315 | Tragic 61.9% |
| Immigrants | Middle Africa | 0.0 /100 | #316 | Tragic 61.9% |
| Immigrants | Bosnia and Herzegovina | 0.0 /100 | #317 | Tragic 61.9% |
| Alaskan Athabascans | 0.0 /100 | #318 | Tragic 61.8% |
| Cape Verdeans | 0.0 /100 | #319 | Tragic 61.8% |
| Ugandans | 0.0 /100 | #320 | Tragic 61.7% |
| Alsatians | 0.0 /100 | #321 | Tragic 61.7% |
| Immigrants | Serbia | 0.0 /100 | #322 | Tragic 61.6% |
| Tlingit-Haida | 0.0 /100 | #323 | Tragic 61.6% |
| Immigrants | West Indies | 0.0 /100 | #324 | Tragic 61.6% |
Demographics Similar to Immigrants from Scotland by Family Households
In terms of family households, the demographic groups most similar to Immigrants from Scotland are Immigrants from China (64.7%, a difference of 0.010%), Basque (64.7%, a difference of 0.020%), Maltese (64.7%, a difference of 0.030%), Immigrants from Jamaica (64.7%, a difference of 0.030%), and Immigrants from North Macedonia (64.7%, a difference of 0.040%).
| Demographics | Rating | Rank | Family Households |
| Immigrants | Italy | 90.2 /100 | #130 | Exceptional 64.8% |
| Immigrants | Nonimmigrants | 90.1 /100 | #131 | Exceptional 64.8% |
| Cajuns | 89.4 /100 | #132 | Excellent 64.8% |
| Belizeans | 89.3 /100 | #133 | Excellent 64.8% |
| Greeks | 88.1 /100 | #134 | Excellent 64.7% |
| Maltese | 87.4 /100 | #135 | Excellent 64.7% |
| Immigrants | China | 86.6 /100 | #136 | Excellent 64.7% |
| Immigrants | Scotland | 86.4 /100 | #137 | Excellent 64.7% |
| Basques | 85.5 /100 | #138 | Excellent 64.7% |
| Immigrants | Jamaica | 85.3 /100 | #139 | Excellent 64.7% |
| Immigrants | North Macedonia | 84.9 /100 | #140 | Excellent 64.7% |
| Immigrants | Cameroon | 84.8 /100 | #141 | Excellent 64.7% |
| Pakistanis | 84.0 /100 | #142 | Excellent 64.7% |
| Czechoslovakians | 82.1 /100 | #143 | Excellent 64.6% |
| South American Indians | 81.9 /100 | #144 | Excellent 64.6% |