Immigrants from Albania vs French Divorced or Separated
COMPARE
Immigrants from Albania
French
Divorced or Separated
Divorced or Separated Comparison
Immigrants from Albania
French
11.5%
DIVORCED OR SEPARATED
99.3/ 100
METRIC RATING
85th/ 347
METRIC RANK
12.8%
DIVORCED OR SEPARATED
0.1/ 100
METRIC RATING
285th/ 347
METRIC RANK
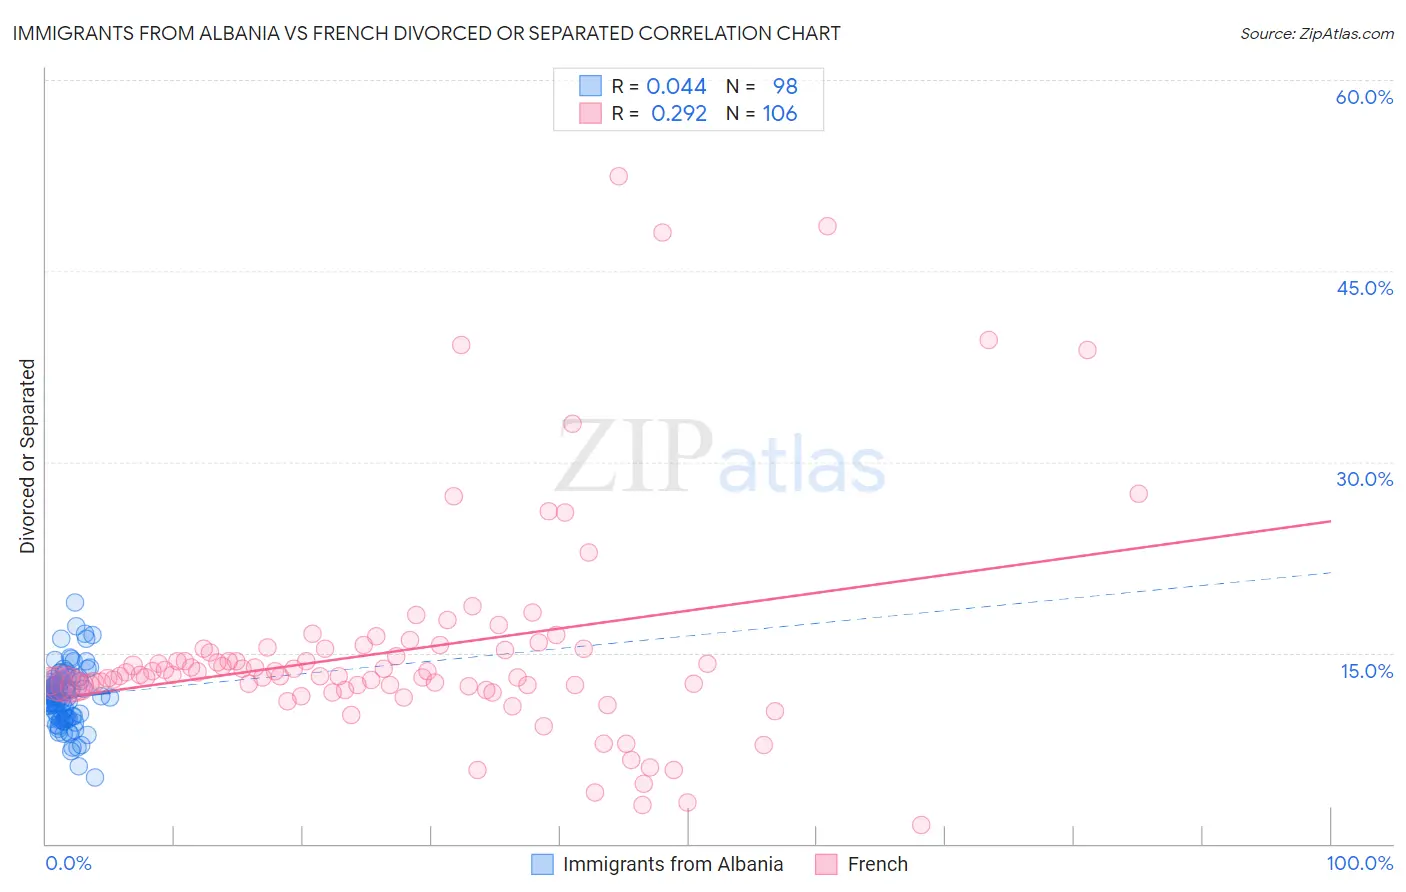
Immigrants from Albania vs French Divorced or Separated Correlation Chart
The statistical analysis conducted on geographies consisting of 119,378,737 people shows no correlation between the proportion of Immigrants from Albania and percentage of population currently divorced or separated in the United States with a correlation coefficient (R) of 0.044 and weighted average of 11.5%. Similarly, the statistical analysis conducted on geographies consisting of 571,939,764 people shows a weak positive correlation between the proportion of French and percentage of population currently divorced or separated in the United States with a correlation coefficient (R) of 0.292 and weighted average of 12.8%, a difference of 10.5%.
Divorced or Separated Correlation Summary
| Measurement | Immigrants from Albania | French |
| Minimum | 5.2% | 1.5% |
| Maximum | 19.0% | 52.4% |
| Range | 13.8% | 50.9% |
| Mean | 11.5% | 15.2% |
| Median | 11.5% | 13.3% |
| Interquartile 25% (IQ1) | 9.9% | 12.4% |
| Interquartile 75% (IQ3) | 12.8% | 15.3% |
| Interquartile Range (IQR) | 2.8% | 2.9% |
| Standard Deviation (Sample) | 2.3% | 8.7% |
| Standard Deviation (Population) | 2.3% | 8.6% |
Similar Demographics by Divorced or Separated
Demographics Similar to Immigrants from Albania by Divorced or Separated
In terms of divorced or separated, the demographic groups most similar to Immigrants from Albania are Bulgarian (11.5%, a difference of 0.060%), Immigrants from Latvia (11.6%, a difference of 0.070%), Immigrants from Bulgaria (11.5%, a difference of 0.080%), Immigrants from Nepal (11.6%, a difference of 0.10%), and Immigrants from Romania (11.5%, a difference of 0.11%).
| Demographics | Rating | Rank | Divorced or Separated |
| Afghans | 99.4 /100 | #78 | Exceptional 11.5% |
| Guyanese | 99.4 /100 | #79 | Exceptional 11.5% |
| Immigrants | Switzerland | 99.4 /100 | #80 | Exceptional 11.5% |
| Russians | 99.4 /100 | #81 | Exceptional 11.5% |
| Immigrants | Romania | 99.3 /100 | #82 | Exceptional 11.5% |
| Immigrants | Bulgaria | 99.3 /100 | #83 | Exceptional 11.5% |
| Bulgarians | 99.3 /100 | #84 | Exceptional 11.5% |
| Immigrants | Albania | 99.3 /100 | #85 | Exceptional 11.5% |
| Immigrants | Latvia | 99.2 /100 | #86 | Exceptional 11.6% |
| Immigrants | Nepal | 99.2 /100 | #87 | Exceptional 11.6% |
| Immigrants | Europe | 99.2 /100 | #88 | Exceptional 11.6% |
| Immigrants | Southern Europe | 99.1 /100 | #89 | Exceptional 11.6% |
| Zimbabweans | 99.0 /100 | #90 | Exceptional 11.6% |
| Spanish American Indians | 99.0 /100 | #91 | Exceptional 11.6% |
| Immigrants | Denmark | 98.9 /100 | #92 | Exceptional 11.6% |
Demographics Similar to French by Divorced or Separated
In terms of divorced or separated, the demographic groups most similar to French are Nonimmigrants (12.8%, a difference of 0.040%), Delaware (12.7%, a difference of 0.13%), Subsaharan African (12.7%, a difference of 0.14%), Spanish (12.8%, a difference of 0.23%), and Pueblo (12.7%, a difference of 0.26%).
| Demographics | Rating | Rank | Divorced or Separated |
| Lumbee | 0.2 /100 | #278 | Tragic 12.7% |
| Immigrants | Dominican Republic | 0.2 /100 | #279 | Tragic 12.7% |
| Immigrants | Zaire | 0.2 /100 | #280 | Tragic 12.7% |
| Pueblo | 0.2 /100 | #281 | Tragic 12.7% |
| Sub-Saharan Africans | 0.1 /100 | #282 | Tragic 12.7% |
| Delaware | 0.1 /100 | #283 | Tragic 12.7% |
| Immigrants | Nonimmigrants | 0.1 /100 | #284 | Tragic 12.8% |
| French | 0.1 /100 | #285 | Tragic 12.8% |
| Spanish | 0.1 /100 | #286 | Tragic 12.8% |
| Hondurans | 0.1 /100 | #287 | Tragic 12.8% |
| French Canadians | 0.1 /100 | #288 | Tragic 12.8% |
| Iroquois | 0.0 /100 | #289 | Tragic 12.9% |
| Pima | 0.0 /100 | #290 | Tragic 12.9% |
| Immigrants | Honduras | 0.0 /100 | #291 | Tragic 12.9% |
| Scotch-Irish | 0.0 /100 | #292 | Tragic 12.9% |