Hopi vs French American Indian Births to Unmarried Women
COMPARE
Hopi
French American Indian
Births to Unmarried Women
Births to Unmarried Women Comparison
Hopi
French American Indians
50.8%
BIRTHS TO UNMARRIED WOMEN
0.0/ 100
METRIC RATING
341st/ 347
METRIC RANK
36.6%
BIRTHS TO UNMARRIED WOMEN
0.1/ 100
METRIC RATING
262nd/ 347
METRIC RANK
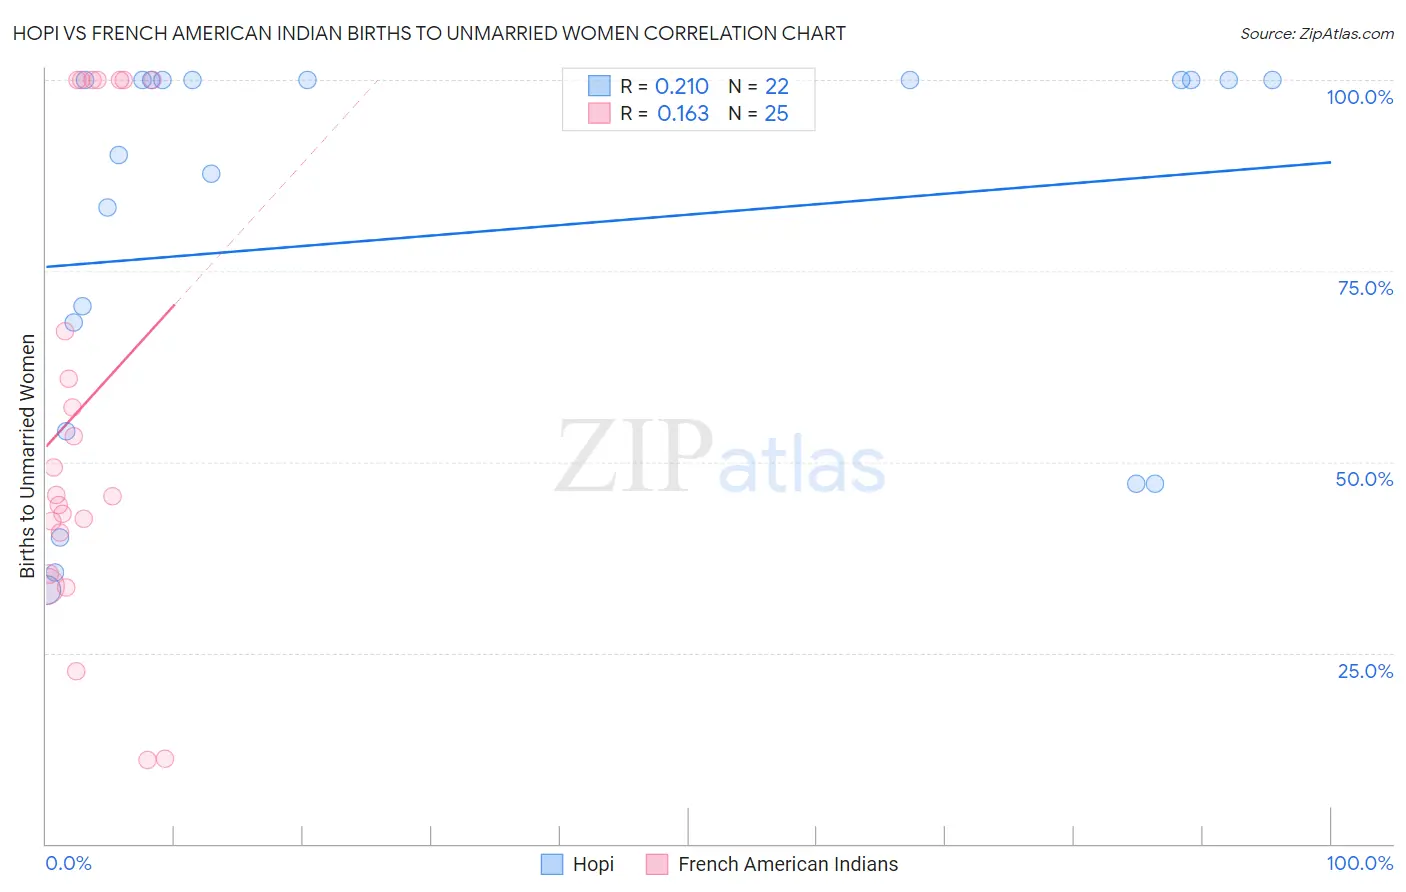
Hopi vs French American Indian Births to Unmarried Women Correlation Chart
The statistical analysis conducted on geographies consisting of 73,772,267 people shows a weak positive correlation between the proportion of Hopi and percentage of births to unmarried women in the United States with a correlation coefficient (R) of 0.210 and weighted average of 50.8%. Similarly, the statistical analysis conducted on geographies consisting of 128,368,933 people shows a poor positive correlation between the proportion of French American Indians and percentage of births to unmarried women in the United States with a correlation coefficient (R) of 0.163 and weighted average of 36.6%, a difference of 38.8%.
Births to Unmarried Women Correlation Summary
| Measurement | Hopi | French American Indian |
| Minimum | 33.2% | 10.9% |
| Maximum | 100.0% | 100.0% |
| Range | 66.8% | 89.1% |
| Mean | 79.9% | 57.6% |
| Median | 95.1% | 45.7% |
| Interquartile 25% (IQ1) | 54.0% | 38.0% |
| Interquartile 75% (IQ3) | 100.0% | 100.0% |
| Interquartile Range (IQR) | 46.0% | 62.0% |
| Standard Deviation (Sample) | 25.3% | 29.9% |
| Standard Deviation (Population) | 24.7% | 29.3% |
Similar Demographics by Births to Unmarried Women
Demographics Similar to Hopi by Births to Unmarried Women
In terms of births to unmarried women, the demographic groups most similar to Hopi are Menominee (51.1%, a difference of 0.59%), Pima (51.5%, a difference of 1.3%), Navajo (51.5%, a difference of 1.3%), Tohono O'odham (49.8%, a difference of 1.9%), and Inupiat (52.1%, a difference of 2.5%).
| Demographics | Rating | Rank | Births to Unmarried Women |
| Blacks/African Americans | 0.0 /100 | #333 | Tragic 44.3% |
| Yuman | 0.0 /100 | #334 | Tragic 44.4% |
| Colville | 0.0 /100 | #335 | Tragic 45.3% |
| Puerto Ricans | 0.0 /100 | #336 | Tragic 45.7% |
| Houma | 0.0 /100 | #337 | Tragic 46.6% |
| Arapaho | 0.0 /100 | #338 | Tragic 47.1% |
| Lumbee | 0.0 /100 | #339 | Tragic 48.2% |
| Tohono O'odham | 0.0 /100 | #340 | Tragic 49.8% |
| Hopi | 0.0 /100 | #341 | Tragic 50.8% |
| Menominee | 0.0 /100 | #342 | Tragic 51.1% |
| Pima | 0.0 /100 | #343 | Tragic 51.5% |
| Navajo | 0.0 /100 | #344 | Tragic 51.5% |
| Inupiat | 0.0 /100 | #345 | Tragic 52.1% |
| Pueblo | 0.0 /100 | #346 | Tragic 53.7% |
| Yup'ik | 0.0 /100 | #347 | Tragic 56.4% |
Demographics Similar to French American Indians by Births to Unmarried Women
In terms of births to unmarried women, the demographic groups most similar to French American Indians are Nicaraguan (36.6%, a difference of 0.020%), Subsaharan African (36.7%, a difference of 0.14%), Cherokee (36.7%, a difference of 0.19%), Immigrants from Senegal (36.7%, a difference of 0.24%), and Central American (36.7%, a difference of 0.31%).
| Demographics | Rating | Rank | Births to Unmarried Women |
| Chickasaw | 0.2 /100 | #255 | Tragic 36.3% |
| Immigrants | Trinidad and Tobago | 0.2 /100 | #256 | Tragic 36.3% |
| Immigrants | Grenada | 0.2 /100 | #257 | Tragic 36.3% |
| Americans | 0.2 /100 | #258 | Tragic 36.4% |
| Immigrants | El Salvador | 0.2 /100 | #259 | Tragic 36.4% |
| Ottawa | 0.2 /100 | #260 | Tragic 36.5% |
| Trinidadians and Tobagonians | 0.2 /100 | #261 | Tragic 36.5% |
| French American Indians | 0.1 /100 | #262 | Tragic 36.6% |
| Nicaraguans | 0.1 /100 | #263 | Tragic 36.6% |
| Sub-Saharan Africans | 0.1 /100 | #264 | Tragic 36.7% |
| Cherokee | 0.1 /100 | #265 | Tragic 36.7% |
| Immigrants | Senegal | 0.1 /100 | #266 | Tragic 36.7% |
| Central Americans | 0.1 /100 | #267 | Tragic 36.7% |
| Comanche | 0.1 /100 | #268 | Tragic 36.7% |
| Senegalese | 0.1 /100 | #269 | Tragic 36.8% |