Guyanese vs Tsimshian Family Households with Children

COMPARE

Guyanese
Race
Ancestry
AfghanAfricanAlaska NativeAlaskan AthabascanAlbanianAleutAlsatianAmericanApacheArabArapahoArgentineanArmenianAssyrian/Chaldean/SyriacAustralianAustrianBahamianBangladeshiBarbadianBasqueBelgianBelizeanBermudanBhutaneseBlackfeetBolivianBrazilianBritishBritish West IndianBulgarianBurmeseCajunCambodianCanadianCape VerdeanCarpatho RusynCelticCentral AmericanCentral American IndianCherokeeCheyenneChickasawChileanChineseChippewaChoctawColombianColvilleComancheCosta RicanCreeCreekCroatianCrowCubanCypriotCzechCzechoslovakianDanishDelawareDominicanDutchDutch West IndianEastern EuropeanEcuadorianEgyptianEnglishEstonianEthiopianEuropeanFijianFilipinoFinnishFrenchFrench American IndianFrench CanadianGermanGerman RussianGhanaianGreekGuamanian/ChamorroGuatemalanGuyaneseHaitianHmongHonduranHopiHoumaHungarianIcelanderIndian (Asian)IndonesianInupiatIranianIraqiIrishIroquoisIsraeliItalianJamaicanJapaneseJordanianKenyanKiowaKoreanLaotianLatvianLebaneseLiberianLithuanianLumbeeLuxembourgerMacedonianMalaysianMalteseMarshalleseMenomineeMexicanMexican American IndianMongolianMoroccanNative HawaiianNavajoNepaleseNew ZealanderNicaraguanNigerianNorthern EuropeanNorwegianOkinawanOsageOttawaPaiutePakistaniPalestinianPanamanianParaguayanPennsylvania GermanPeruvianPimaPolishPortuguesePotawatomiPuebloPuerto RicanPuget Sound SalishRomanianRussianSalvadoranSamoanScandinavianScotch-IrishScottishSeminoleSenegaleseSerbianShoshoneSierra LeoneanSiouxSlavicSlovakSloveneSomaliSouth AfricanSouth AmericanSouth American IndianSoviet UnionSpaniardSpanishSpanish AmericanSpanish American IndianSri LankanSubsaharan AfricanSudaneseSwedishSwissSyrianTaiwaneseThaiTlingit-HaidaTohono O'OdhamTonganTrinidadian and TobagonianTurkishU.S. Virgin IslanderUgandanUkrainianUruguayanUteVenezuelanVietnameseWelshWest IndianYakamaYaquiYugoslavianYumanYup'ikZimbabwean
Immigration
NonimmigrantsImmigrantsAfghanistanAfricaAlbaniaArgentinaArmeniaAsiaAustraliaAustriaBahamasBangladeshBarbadosBelarusBelgiumBelizeBoliviaBosnia and HerzegovinaBrazilBulgariaBurma/MyanmarCabo VerdeCambodiaCameroonCanadaCaribbeanCentral AmericaChileChinaColombiaCongoCosta RicaCroatiaCubaCzechoslovakiaDenmarkDominicaDominican RepublicEastern AfricaEastern AsiaEastern EuropeEcuadorEgyptEl SalvadorEnglandEritreaEthiopiaEuropeFijiFranceGermanyGhanaGreeceGrenadaGuatemalaGuyanaHaitiHondurasHong KongHungaryIndiaIndonesiaIranIraqIrelandIsraelItalyJamaicaJapanJordanKazakhstanKenyaKoreaKuwaitLaosLatin AmericaLatviaLebanonLiberiaLithuaniaMalaysiaMexicoMicronesiaMiddle AfricaMoldovaMoroccoNepalNetherlandsNicaraguaNigeriaNorth AmericaNorth MacedoniaNorthern AfricaNorthern EuropeNorwayOceaniaPakistanPanamaPeruPhilippinesPolandPortugalRomaniaRussiaSaudi ArabiaScotlandSenegalSerbiaSierra LeoneSingaporeSomaliaSouth AfricaSouth AmericaSouth Central AsiaSouth Eastern AsiaSouthern EuropeSpainSri LankaSt. Vincent and the GrenadinesSudanSwedenSwitzerlandSyriaTaiwanThailandTrinidad and TobagoTurkeyUgandaUkraineUruguayUzbekistanVenezuelaVietnamWest IndiesWestern AfricaWestern AsiaWestern EuropeYemenZaireZimbabweAzores
Tsimshian
Race
Ancestry
AfghanAfricanAlaska NativeAlaskan AthabascanAlbanianAleutAlsatianAmericanApacheArabArapahoArgentineanArmenianAssyrian/Chaldean/SyriacAustralianAustrianBahamianBangladeshiBarbadianBasqueBelgianBelizeanBermudanBhutaneseBlackfeetBolivianBrazilianBritishBritish West IndianBulgarianBurmeseCajunCambodianCanadianCape VerdeanCarpatho RusynCelticCentral AmericanCentral American IndianCherokeeCheyenneChickasawChileanChineseChippewaChoctawColombianColvilleComancheCosta RicanCreeCreekCroatianCrowCubanCypriotCzechCzechoslovakianDanishDelawareDominicanDutchDutch West IndianEastern EuropeanEcuadorianEgyptianEnglishEstonianEthiopianEuropeanFijianFilipinoFinnishFrenchFrench American IndianFrench CanadianGermanGerman RussianGhanaianGreekGuamanian/ChamorroGuatemalanHaitianHmongHonduranHopiHoumaHungarianIcelanderIndian (Asian)IndonesianInupiatIranianIraqiIrishIroquoisIsraeliItalianJamaicanJapaneseJordanianKenyanKiowaKoreanLaotianLatvianLebaneseLiberianLithuanianLumbeeLuxembourgerMacedonianMalaysianMalteseMarshalleseMenomineeMexicanMexican American IndianMongolianMoroccanNative HawaiianNavajoNepaleseNew ZealanderNicaraguanNigerianNorthern EuropeanNorwegianOkinawanOsageOttawaPaiutePakistaniPalestinianPanamanianParaguayanPennsylvania GermanPeruvianPimaPolishPortuguesePotawatomiPuebloPuerto RicanPuget Sound SalishRomanianRussianSalvadoranSamoanScandinavianScotch-IrishScottishSeminoleSenegaleseSerbianShoshoneSierra LeoneanSiouxSlavicSlovakSloveneSomaliSouth AfricanSouth AmericanSouth American IndianSoviet UnionSpaniardSpanishSpanish AmericanSpanish American IndianSri LankanSubsaharan AfricanSudaneseSwedishSwissSyrianTaiwaneseThaiTlingit-HaidaTohono O'OdhamTonganTrinidadian and TobagonianTsimshianTurkishU.S. Virgin IslanderUgandanUkrainianUruguayanUteVenezuelanVietnameseWelshWest IndianYakamaYaquiYugoslavianYumanYup'ikZimbabwean
Immigration
NonimmigrantsImmigrantsAfghanistanAfricaAlbaniaArgentinaArmeniaAsiaAustraliaAustriaBahamasBangladeshBarbadosBelarusBelgiumBelizeBoliviaBosnia and HerzegovinaBrazilBulgariaBurma/MyanmarCabo VerdeCambodiaCameroonCanadaCaribbeanCentral AmericaChileChinaColombiaCongoCosta RicaCroatiaCubaCzechoslovakiaDenmarkDominicaDominican RepublicEastern AfricaEastern AsiaEastern EuropeEcuadorEgyptEl SalvadorEnglandEritreaEthiopiaEuropeFijiFranceGermanyGhanaGreeceGrenadaGuatemalaGuyanaHaitiHondurasHong KongHungaryIndiaIndonesiaIranIraqIrelandIsraelItalyJamaicaJapanJordanKazakhstanKenyaKoreaKuwaitLaosLatin AmericaLatviaLebanonLiberiaLithuaniaMalaysiaMexicoMicronesiaMiddle AfricaMoldovaMoroccoNepalNetherlandsNicaraguaNigeriaNorth AmericaNorth MacedoniaNorthern AfricaNorthern EuropeNorwayOceaniaPakistanPanamaPeruPhilippinesPolandPortugalRomaniaRussiaSaudi ArabiaScotlandSenegalSerbiaSierra LeoneSingaporeSomaliaSouth AfricaSouth AmericaSouth Central AsiaSouth Eastern AsiaSouthern EuropeSpainSri LankaSt. Vincent and the GrenadinesSudanSwedenSwitzerlandSyriaTaiwanThailandTrinidad and TobagoTurkeyUgandaUkraineUruguayUzbekistanVenezuelaVietnamWest IndiesWestern AfricaWestern AsiaWestern EuropeYemenZaireZimbabweAzores
Family Households with Children
Income
Poverty
Unemployment
Labor Participation
Family Structure
Vehicle Availability
Education Level
Disability

Family Households with Children Comparison

Guyanese

Tsimshian

Tragic
Tragic
26.3%
FAMILY HOUSEHOLDS WITH CHILDREN
0.1/ 100
METRIC RATING
305th/ 347
METRIC RANK
27.0%
FAMILY HOUSEHOLDS WITH CHILDREN
6.6/ 100
METRIC RATING
227th/ 347
METRIC RANK

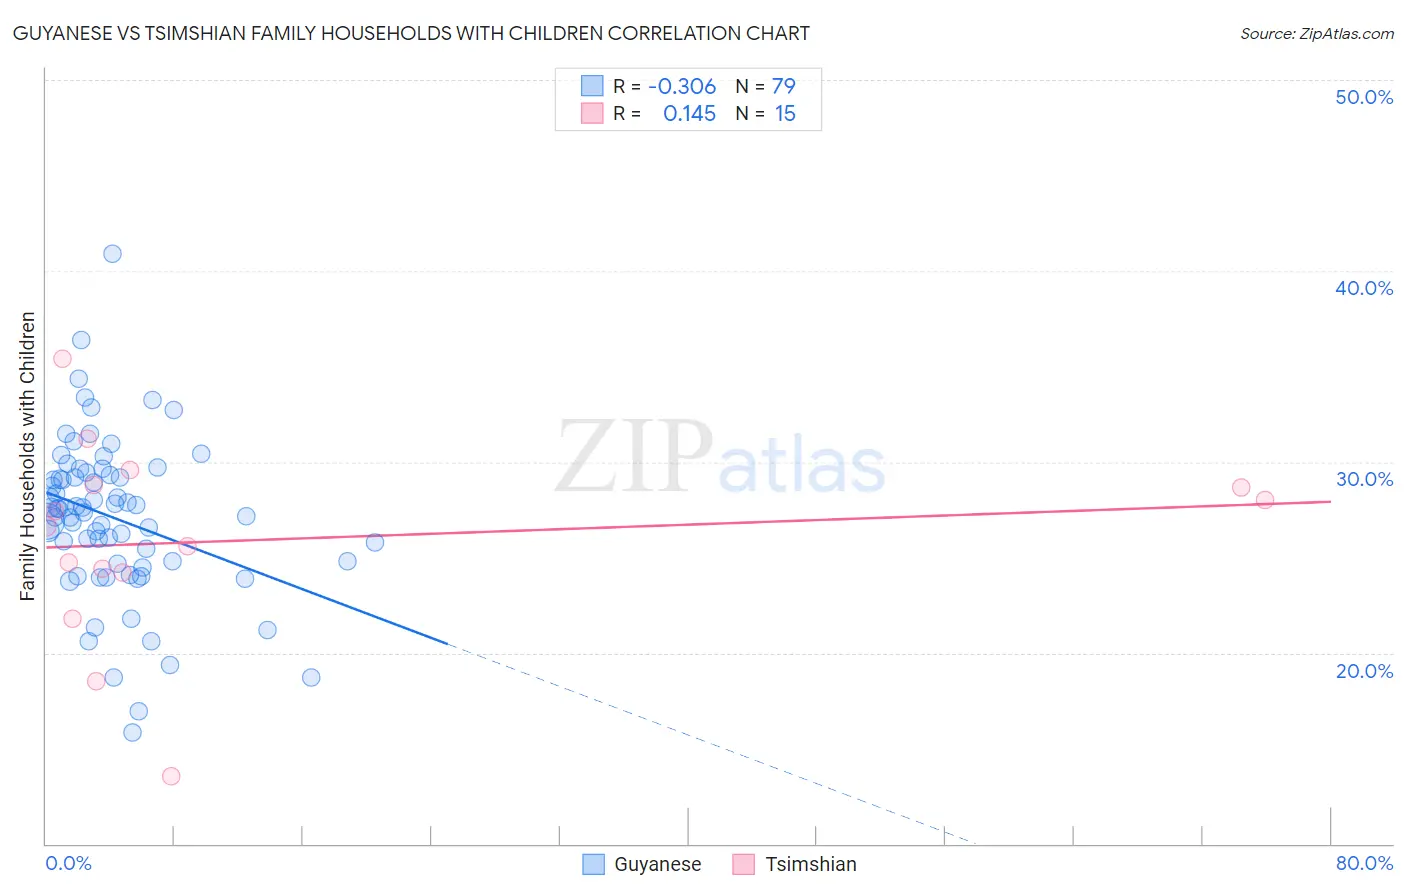
Guyanese vs Tsimshian Family Households with Children Correlation Chart

The statistical analysis conducted on geographies consisting of 176,724,893 people shows a mild negative correlation between the proportion of Guyanese and percentage of family households with children in the United States with a correlation coefficient (R) of -0.306 and weighted average of 26.3%. Similarly, the statistical analysis conducted on geographies consisting of 15,626,544 people shows a poor positive correlation between the proportion of Tsimshian and percentage of family households with children in the United States with a correlation coefficient (R) of 0.145 and weighted average of 27.0%, a difference of 2.8%.
Guyanese vs Tsimshian Family Households with Children

Family Households with Children Correlation Summary

MeasurementGuyaneseTsimshian
Minimum15.8%13.6%
Maximum40.9%35.4%
Range25.1%21.9%
Mean27.1%25.9%
Median27.5%26.6%
Interquartile 25% (IQ1)24.7%24.2%
Interquartile 75% (IQ3)29.3%28.8%
Interquartile Range (IQR)4.7%4.6%
Standard Deviation (Sample)4.2%5.2%
Standard Deviation (Population)4.2%5.1%

Similar Demographics by Family Households with Children

Demographics Similar to Guyanese by Family Households with Children

In terms of family households with children, the demographic groups most similar to Guyanese are Bermudan (26.3%, a difference of 0.010%), Immigrants from Bahamas (26.3%, a difference of 0.030%), Immigrants from Guyana (26.3%, a difference of 0.080%), West Indian (26.3%, a difference of 0.10%), and Serbian (26.4%, a difference of 0.11%).
DemographicsRating | RankFamily Households with Children
Immigrants | Western Europe
0.1
/100
|
#298
Tragic
26.4%
Trinidadians and Tobagonians
0.1
/100
|
#299
Tragic
26.4%
Paiute
0.1
/100
|
#300
Tragic
26.4%
Immigrants | Trinidad and Tobago
0.1
/100
|
#301
Tragic
26.4%
Serbians
0.1
/100
|
#302
Tragic
26.4%
Immigrants | Guyana
0.1
/100
|
#303
Tragic
26.3%
Immigrants | Bahamas
0.1
/100
|
#304
Tragic
26.3%
Guyanese
0.1
/100
|
#305
Tragic
26.3%
Bermudans
0.1
/100
|
#306
Tragic
26.3%
West Indians
0.0
/100
|
#307
Tragic
26.3%
Lumbee
0.0
/100
|
#308
Tragic
26.3%
Immigrants | Somalia
0.0
/100
|
#309
Tragic
26.3%
Marshallese
0.0
/100
|
#310
Tragic
26.2%
Colville
0.0
/100
|
#311
Tragic
26.2%
Immigrants | Czechoslovakia
0.0
/100
|
#312
Tragic
26.2%

Demographics Similar to Tsimshian by Family Households with Children

In terms of family households with children, the demographic groups most similar to Tsimshian are Czechoslovakian (27.0%, a difference of 0.0%), Scottish (27.0%, a difference of 0.0%), Immigrants from Caribbean (27.0%, a difference of 0.030%), Canadian (27.1%, a difference of 0.080%), and Bulgarian (27.0%, a difference of 0.080%).
DemographicsRating | RankFamily Households with Children
Austrians
9.9
/100
|
#220
Tragic
27.1%
New Zealanders
9.6
/100
|
#221
Tragic
27.1%
Paraguayans
9.4
/100
|
#222
Tragic
27.1%
Pima
9.2
/100
|
#223
Tragic
27.1%
Germans
8.7
/100
|
#224
Tragic
27.1%
Canadians
7.5
/100
|
#225
Tragic
27.1%
Czechoslovakians
6.6
/100
|
#226
Tragic
27.0%
Tsimshian
6.6
/100
|
#227
Tragic
27.0%
Scottish
6.5
/100
|
#228
Tragic
27.0%
Immigrants | Caribbean
6.3
/100
|
#229
Tragic
27.0%
Bulgarians
5.8
/100
|
#230
Tragic
27.0%
Luxembourgers
5.5
/100
|
#231
Tragic
27.0%
Yugoslavians
5.1
/100
|
#232
Tragic
27.0%
Immigrants | Italy
5.0
/100
|
#233
Tragic
27.0%
Immigrants | Germany
4.4
/100
|
#234
Tragic
27.0%