French Canadian vs Laotian Currently Married
COMPARE
French Canadian
Laotian
Currently Married
Currently Married Comparison
French Canadians
Laotians
48.0%
CURRENTLY MARRIED
96.3/ 100
METRIC RATING
85th/ 347
METRIC RANK
47.4%
CURRENTLY MARRIED
86.6/ 100
METRIC RATING
124th/ 347
METRIC RANK
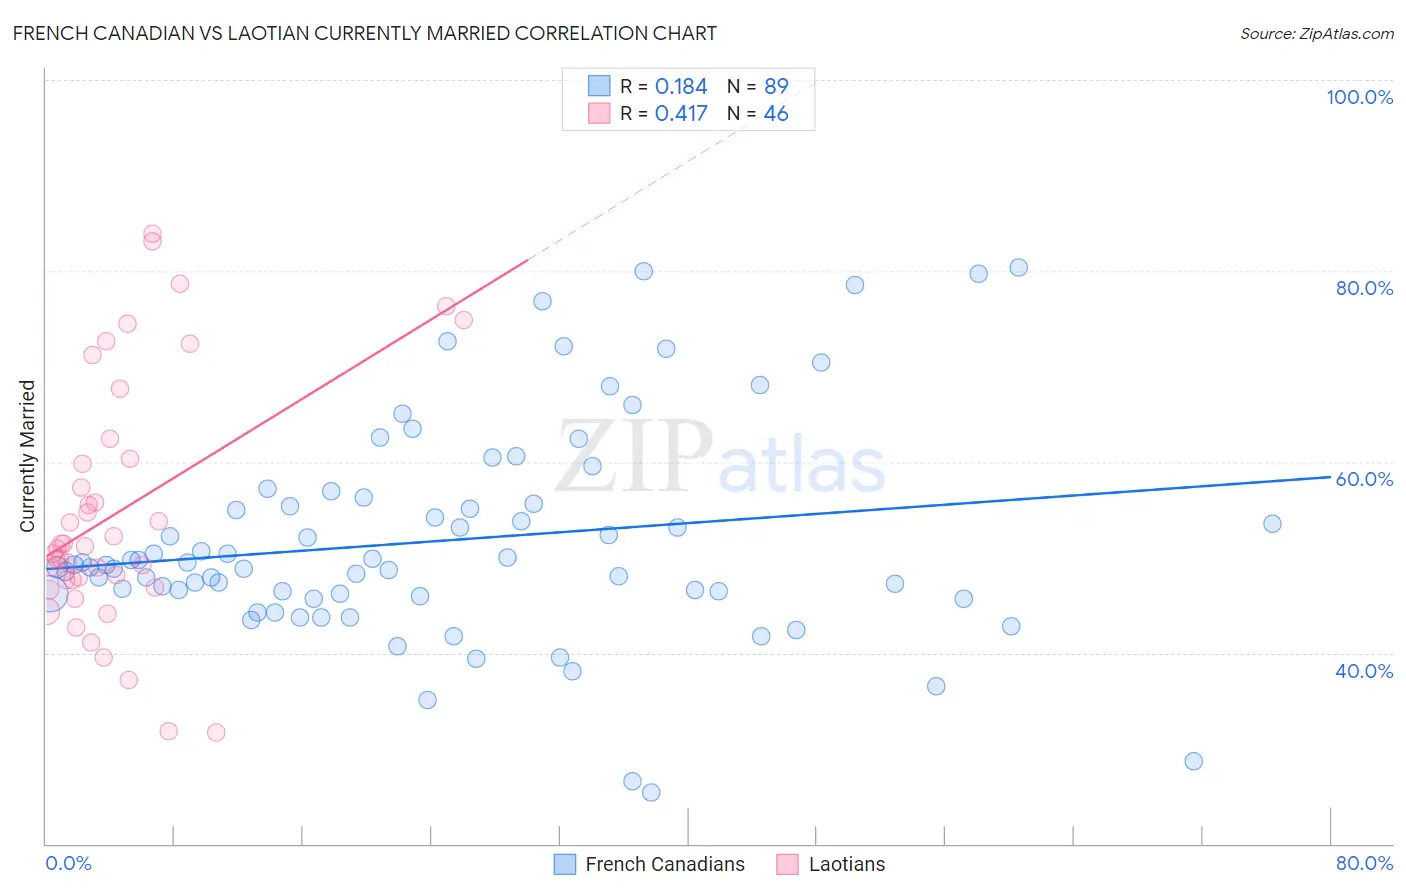
French Canadian vs Laotian Currently Married Correlation Chart
The statistical analysis conducted on geographies consisting of 502,604,135 people shows a poor positive correlation between the proportion of French Canadians and percentage of population currently married in the United States with a correlation coefficient (R) of 0.184 and weighted average of 48.0%. Similarly, the statistical analysis conducted on geographies consisting of 224,816,761 people shows a moderate positive correlation between the proportion of Laotians and percentage of population currently married in the United States with a correlation coefficient (R) of 0.417 and weighted average of 47.4%, a difference of 1.3%.
Currently Married Correlation Summary
| Measurement | French Canadian | Laotian |
| Minimum | 25.4% | 31.6% |
| Maximum | 80.4% | 83.9% |
| Range | 55.0% | 52.3% |
| Mean | 51.8% | 54.7% |
| Median | 49.2% | 51.1% |
| Interquartile 25% (IQ1) | 46.0% | 47.6% |
| Interquartile 75% (IQ3) | 55.9% | 60.4% |
| Interquartile Range (IQR) | 9.9% | 12.7% |
| Standard Deviation (Sample) | 11.3% | 12.9% |
| Standard Deviation (Population) | 11.3% | 12.8% |
Similar Demographics by Currently Married
Demographics Similar to French Canadians by Currently Married
In terms of currently married, the demographic groups most similar to French Canadians are Immigrants from Japan (48.0%, a difference of 0.030%), Jordanian (48.0%, a difference of 0.040%), Immigrants from Eastern Europe (48.0%, a difference of 0.060%), Indian (Asian) (48.0%, a difference of 0.12%), and Bolivian (48.1%, a difference of 0.14%).
| Demographics | Rating | Rank | Currently Married |
| Immigrants | Belgium | 97.1 /100 | #78 | Exceptional 48.1% |
| Immigrants | South Africa | 97.0 /100 | #79 | Exceptional 48.1% |
| Immigrants | Poland | 96.9 /100 | #80 | Exceptional 48.1% |
| Immigrants | Sri Lanka | 96.9 /100 | #81 | Exceptional 48.1% |
| Immigrants | Europe | 96.9 /100 | #82 | Exceptional 48.1% |
| Bolivians | 96.9 /100 | #83 | Exceptional 48.1% |
| Immigrants | Israel | 96.9 /100 | #84 | Exceptional 48.1% |
| French Canadians | 96.3 /100 | #85 | Exceptional 48.0% |
| Immigrants | Japan | 96.2 /100 | #86 | Exceptional 48.0% |
| Jordanians | 96.2 /100 | #87 | Exceptional 48.0% |
| Immigrants | Eastern Europe | 96.1 /100 | #88 | Exceptional 48.0% |
| Indians (Asian) | 95.8 /100 | #89 | Exceptional 48.0% |
| Americans | 95.7 /100 | #90 | Exceptional 48.0% |
| Immigrants | Bolivia | 95.6 /100 | #91 | Exceptional 47.9% |
| Koreans | 95.4 /100 | #92 | Exceptional 47.9% |
Demographics Similar to Laotians by Currently Married
In terms of currently married, the demographic groups most similar to Laotians are Immigrants from Kazakhstan (47.4%, a difference of 0.050%), Okinawan (47.4%, a difference of 0.10%), Osage (47.5%, a difference of 0.11%), Immigrants from Jordan (47.4%, a difference of 0.13%), and New Zealander (47.4%, a difference of 0.13%).
| Demographics | Rating | Rank | Currently Married |
| Puget Sound Salish | 90.3 /100 | #117 | Exceptional 47.6% |
| Immigrants | Philippines | 90.2 /100 | #118 | Exceptional 47.6% |
| Australians | 90.2 /100 | #119 | Exceptional 47.6% |
| Syrians | 88.9 /100 | #120 | Excellent 47.5% |
| Immigrants | Croatia | 88.6 /100 | #121 | Excellent 47.5% |
| Osage | 87.9 /100 | #122 | Excellent 47.5% |
| Immigrants | Kazakhstan | 87.2 /100 | #123 | Excellent 47.4% |
| Laotians | 86.6 /100 | #124 | Excellent 47.4% |
| Okinawans | 85.3 /100 | #125 | Excellent 47.4% |
| Immigrants | Jordan | 84.9 /100 | #126 | Excellent 47.4% |
| New Zealanders | 84.9 /100 | #127 | Excellent 47.4% |
| Portuguese | 84.2 /100 | #128 | Excellent 47.3% |
| Sri Lankans | 83.2 /100 | #129 | Excellent 47.3% |
| Immigrants | Iraq | 82.8 /100 | #130 | Excellent 47.3% |
| Icelanders | 82.4 /100 | #131 | Excellent 47.3% |