Dutch West Indian vs Immigrants from Kuwait Single Father Households
COMPARE
Dutch West Indian
Immigrants from Kuwait
Single Father Households
Single Father Households Comparison
Dutch West Indians
Immigrants from Kuwait
2.6%
SINGLE FATHER HOUSEHOLDS
0.1/ 100
METRIC RATING
282nd/ 347
METRIC RANK
2.1%
SINGLE FATHER HOUSEHOLDS
99.8/ 100
METRIC RATING
71st/ 347
METRIC RANK
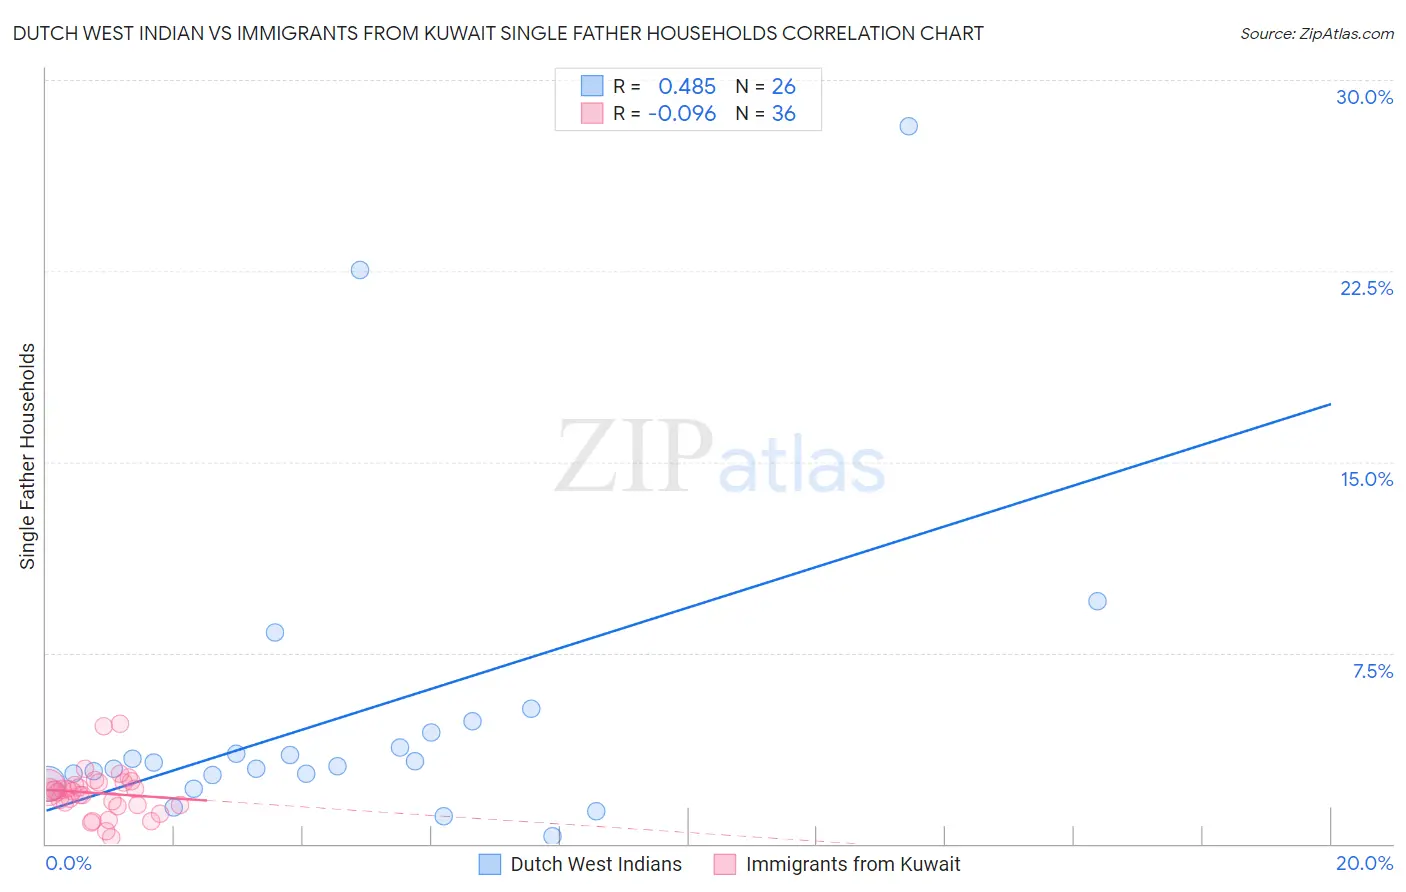
Dutch West Indian vs Immigrants from Kuwait Single Father Households Correlation Chart
The statistical analysis conducted on geographies consisting of 85,485,397 people shows a moderate positive correlation between the proportion of Dutch West Indians and percentage of single father households in the United States with a correlation coefficient (R) of 0.485 and weighted average of 2.6%. Similarly, the statistical analysis conducted on geographies consisting of 136,715,758 people shows a slight negative correlation between the proportion of Immigrants from Kuwait and percentage of single father households in the United States with a correlation coefficient (R) of -0.096 and weighted average of 2.1%, a difference of 27.7%.
Single Father Households Correlation Summary
| Measurement | Dutch West Indian | Immigrants from Kuwait |
| Minimum | 0.30% | 0.25% |
| Maximum | 28.2% | 4.7% |
| Range | 27.9% | 4.5% |
| Mean | 5.1% | 2.0% |
| Median | 3.1% | 2.1% |
| Interquartile 25% (IQ1) | 2.7% | 1.5% |
| Interquartile 75% (IQ3) | 4.4% | 2.3% |
| Interquartile Range (IQR) | 1.6% | 0.82% |
| Standard Deviation (Sample) | 6.3% | 0.91% |
| Standard Deviation (Population) | 6.2% | 0.90% |
Similar Demographics by Single Father Households
Demographics Similar to Dutch West Indians by Single Father Households
In terms of single father households, the demographic groups most similar to Dutch West Indians are Nicaraguan (2.6%, a difference of 0.050%), Immigrants from Portugal (2.6%, a difference of 0.060%), Samoan (2.6%, a difference of 0.61%), Cherokee (2.6%, a difference of 0.65%), and Immigrants from Nicaragua (2.7%, a difference of 0.69%).
| Demographics | Rating | Rank | Single Father Households |
| Immigrants | Dominican Republic | 0.2 /100 | #275 | Tragic 2.6% |
| Immigrants | Haiti | 0.1 /100 | #276 | Tragic 2.6% |
| Shoshone | 0.1 /100 | #277 | Tragic 2.6% |
| Cherokee | 0.1 /100 | #278 | Tragic 2.6% |
| Samoans | 0.1 /100 | #279 | Tragic 2.6% |
| Immigrants | Portugal | 0.1 /100 | #280 | Tragic 2.6% |
| Nicaraguans | 0.1 /100 | #281 | Tragic 2.6% |
| Dutch West Indians | 0.1 /100 | #282 | Tragic 2.6% |
| Immigrants | Nicaragua | 0.1 /100 | #283 | Tragic 2.7% |
| Hawaiians | 0.1 /100 | #284 | Tragic 2.7% |
| Ottawa | 0.1 /100 | #285 | Tragic 2.7% |
| Immigrants | Cuba | 0.1 /100 | #286 | Tragic 2.7% |
| Central American Indians | 0.0 /100 | #287 | Tragic 2.7% |
| Immigrants | Cambodia | 0.0 /100 | #288 | Tragic 2.7% |
| Tlingit-Haida | 0.0 /100 | #289 | Tragic 2.7% |
Demographics Similar to Immigrants from Kuwait by Single Father Households
In terms of single father households, the demographic groups most similar to Immigrants from Kuwait are Immigrants from Spain (2.1%, a difference of 0.0%), Egyptian (2.1%, a difference of 0.010%), Immigrants from Bangladesh (2.1%, a difference of 0.15%), Immigrants from Egypt (2.1%, a difference of 0.15%), and Immigrants from Romania (2.1%, a difference of 0.22%).
| Demographics | Rating | Rank | Single Father Households |
| Mongolians | 99.9 /100 | #64 | Exceptional 2.1% |
| Paraguayans | 99.9 /100 | #65 | Exceptional 2.1% |
| Immigrants | Western Asia | 99.8 /100 | #66 | Exceptional 2.1% |
| Immigrants | Italy | 99.8 /100 | #67 | Exceptional 2.1% |
| Immigrants | Denmark | 99.8 /100 | #68 | Exceptional 2.1% |
| Immigrants | Romania | 99.8 /100 | #69 | Exceptional 2.1% |
| Egyptians | 99.8 /100 | #70 | Exceptional 2.1% |
| Immigrants | Kuwait | 99.8 /100 | #71 | Exceptional 2.1% |
| Immigrants | Spain | 99.8 /100 | #72 | Exceptional 2.1% |
| Immigrants | Bangladesh | 99.8 /100 | #73 | Exceptional 2.1% |
| Immigrants | Egypt | 99.8 /100 | #74 | Exceptional 2.1% |
| Immigrants | Sweden | 99.8 /100 | #75 | Exceptional 2.1% |
| Immigrants | Scotland | 99.8 /100 | #76 | Exceptional 2.1% |
| Immigrants | Saudi Arabia | 99.8 /100 | #77 | Exceptional 2.1% |
| Estonians | 99.7 /100 | #78 | Exceptional 2.1% |