Croatian vs Arab Single Mother Households

COMPARE

Croatian
Race
Ancestry
AfghanAfricanAlaska NativeAlaskan AthabascanAlbanianAleutAlsatianAmericanApacheArapahoArgentineanArmenianAssyrian/Chaldean/SyriacAustralianAustrianBahamianBangladeshiBarbadianBasqueBelgianBelizeanBermudanBhutaneseBlackfeetBolivianBrazilianBritishBritish West IndianBulgarianBurmeseCajunCambodianCanadianCape VerdeanCarpatho RusynCelticCentral AmericanCentral American IndianCherokeeCheyenneChickasawChileanChineseChippewaChoctawColombianColvilleComancheCosta RicanCreeCreekCroatianCrowCubanCypriotCzechCzechoslovakianDanishDelawareDominicanDutchDutch West IndianEastern EuropeanEcuadorianEgyptianEnglishEstonianEthiopianEuropeanFijianFilipinoFinnishFrenchFrench American IndianFrench CanadianGermanGerman RussianGhanaianGreekGuamanian/ChamorroGuatemalanGuyaneseHaitianHmongHonduranHopiHoumaHungarianIcelanderIndian (Asian)IndonesianInupiatIranianIraqiIrishIroquoisIsraeliItalianJamaicanJapaneseJordanianKenyanKiowaKoreanLaotianLatvianLebaneseLiberianLithuanianLumbeeLuxembourgerMacedonianMalaysianMalteseMarshalleseMenomineeMexicanMexican American IndianMongolianMoroccanNative HawaiianNavajoNepaleseNew ZealanderNicaraguanNigerianNorthern EuropeanNorwegianOkinawanOsageOttawaPaiutePakistaniPalestinianPanamanianParaguayanPennsylvania GermanPeruvianPimaPolishPortuguesePotawatomiPuebloPuerto RicanPuget Sound SalishRomanianRussianSalvadoranSamoanScandinavianScotch-IrishScottishSeminoleSenegaleseSerbianShoshoneSierra LeoneanSiouxSlavicSlovakSloveneSomaliSouth AfricanSouth AmericanSouth American IndianSoviet UnionSpaniardSpanishSpanish AmericanSpanish American IndianSri LankanSubsaharan AfricanSudaneseSwedishSwissSyrianTaiwaneseThaiTlingit-HaidaTohono O'OdhamTonganTrinidadian and TobagonianTsimshianTurkishU.S. Virgin IslanderUgandanUkrainianUruguayanUteVenezuelanVietnameseWelshWest IndianYakamaYaquiYugoslavianYumanYup'ikZimbabwean
Immigration
NonimmigrantsImmigrantsAfghanistanAfricaAlbaniaArgentinaArmeniaAsiaAustraliaAustriaBahamasBangladeshBarbadosBelarusBelgiumBelizeBoliviaBosnia and HerzegovinaBrazilBulgariaBurma/MyanmarCabo VerdeCambodiaCameroonCanadaCaribbeanCentral AmericaChileChinaColombiaCongoCosta RicaCroatiaCubaCzechoslovakiaDenmarkDominicaDominican RepublicEastern AfricaEastern AsiaEastern EuropeEcuadorEgyptEl SalvadorEnglandEritreaEthiopiaEuropeFijiFranceGermanyGhanaGreeceGrenadaGuatemalaGuyanaHaitiHondurasHong KongHungaryIndiaIndonesiaIranIraqIrelandIsraelItalyJamaicaJapanJordanKazakhstanKenyaKoreaKuwaitLaosLatin AmericaLatviaLebanonLiberiaLithuaniaMalaysiaMexicoMicronesiaMiddle AfricaMoldovaMoroccoNepalNetherlandsNicaraguaNigeriaNorth AmericaNorth MacedoniaNorthern AfricaNorthern EuropeNorwayOceaniaPakistanPanamaPeruPhilippinesPolandPortugalRomaniaRussiaSaudi ArabiaScotlandSenegalSerbiaSierra LeoneSingaporeSomaliaSouth AfricaSouth AmericaSouth Central AsiaSouth Eastern AsiaSouthern EuropeSpainSri LankaSt. Vincent and the GrenadinesSudanSwedenSwitzerlandSyriaTaiwanThailandTrinidad and TobagoTurkeyUgandaUkraineUruguayUzbekistanVenezuelaVietnamWest IndiesWestern AfricaWestern AsiaWestern EuropeYemenZaireZimbabweAzores
Arab
Race
Ancestry
AfghanAfricanAlaska NativeAlaskan AthabascanAlbanianAleutAlsatianAmericanApacheArabArapahoArgentineanArmenianAssyrian/Chaldean/SyriacAustralianAustrianBahamianBangladeshiBarbadianBasqueBelgianBelizeanBermudanBhutaneseBlackfeetBolivianBrazilianBritishBritish West IndianBulgarianBurmeseCajunCambodianCanadianCape VerdeanCarpatho RusynCelticCentral AmericanCentral American IndianCherokeeCheyenneChickasawChileanChineseChippewaChoctawColombianColvilleComancheCosta RicanCreeCreekCrowCubanCypriotCzechCzechoslovakianDanishDelawareDominicanDutchDutch West IndianEastern EuropeanEcuadorianEgyptianEnglishEstonianEthiopianEuropeanFijianFilipinoFinnishFrenchFrench American IndianFrench CanadianGermanGerman RussianGhanaianGreekGuamanian/ChamorroGuatemalanGuyaneseHaitianHmongHonduranHopiHoumaHungarianIcelanderIndian (Asian)IndonesianInupiatIranianIraqiIrishIroquoisIsraeliItalianJamaicanJapaneseJordanianKenyanKiowaKoreanLaotianLatvianLebaneseLiberianLithuanianLumbeeLuxembourgerMacedonianMalaysianMalteseMarshalleseMenomineeMexicanMexican American IndianMongolianMoroccanNative HawaiianNavajoNepaleseNew ZealanderNicaraguanNigerianNorthern EuropeanNorwegianOkinawanOsageOttawaPaiutePakistaniPalestinianPanamanianParaguayanPennsylvania GermanPeruvianPimaPolishPortuguesePotawatomiPuebloPuerto RicanPuget Sound SalishRomanianRussianSalvadoranSamoanScandinavianScotch-IrishScottishSeminoleSenegaleseSerbianShoshoneSierra LeoneanSiouxSlavicSlovakSloveneSomaliSouth AfricanSouth AmericanSouth American IndianSoviet UnionSpaniardSpanishSpanish AmericanSpanish American IndianSri LankanSubsaharan AfricanSudaneseSwedishSwissSyrianTaiwaneseThaiTlingit-HaidaTohono O'OdhamTonganTrinidadian and TobagonianTsimshianTurkishU.S. Virgin IslanderUgandanUkrainianUruguayanUteVenezuelanVietnameseWelshWest IndianYakamaYaquiYugoslavianYumanYup'ikZimbabwean
Immigration
NonimmigrantsImmigrantsAfghanistanAfricaAlbaniaArgentinaArmeniaAsiaAustraliaAustriaBahamasBangladeshBarbadosBelarusBelgiumBelizeBoliviaBosnia and HerzegovinaBrazilBulgariaBurma/MyanmarCabo VerdeCambodiaCameroonCanadaCaribbeanCentral AmericaChileChinaColombiaCongoCosta RicaCroatiaCubaCzechoslovakiaDenmarkDominicaDominican RepublicEastern AfricaEastern AsiaEastern EuropeEcuadorEgyptEl SalvadorEnglandEritreaEthiopiaEuropeFijiFranceGermanyGhanaGreeceGrenadaGuatemalaGuyanaHaitiHondurasHong KongHungaryIndiaIndonesiaIranIraqIrelandIsraelItalyJamaicaJapanJordanKazakhstanKenyaKoreaKuwaitLaosLatin AmericaLatviaLebanonLiberiaLithuaniaMalaysiaMexicoMicronesiaMiddle AfricaMoldovaMoroccoNepalNetherlandsNicaraguaNigeriaNorth AmericaNorth MacedoniaNorthern AfricaNorthern EuropeNorwayOceaniaPakistanPanamaPeruPhilippinesPolandPortugalRomaniaRussiaSaudi ArabiaScotlandSenegalSerbiaSierra LeoneSingaporeSomaliaSouth AfricaSouth AmericaSouth Central AsiaSouth Eastern AsiaSouthern EuropeSpainSri LankaSt. Vincent and the GrenadinesSudanSwedenSwitzerlandSyriaTaiwanThailandTrinidad and TobagoTurkeyUgandaUkraineUruguayUzbekistanVenezuelaVietnamWest IndiesWestern AfricaWestern AsiaWestern EuropeYemenZaireZimbabweAzores
Single Mother Households
Income
Poverty
Unemployment
Labor Participation
Family Structure
Vehicle Availability
Education Level
Disability

Single Mother Households Comparison

Croatians

Arabs

Exceptional
Excellent
5.5%
SINGLE MOTHER HOUSEHOLDS
99.3/ 100
METRIC RATING
46th/ 347
METRIC RANK
6.0%
SINGLE MOTHER HOUSEHOLDS
84.0/ 100
METRIC RATING
145th/ 347
METRIC RANK

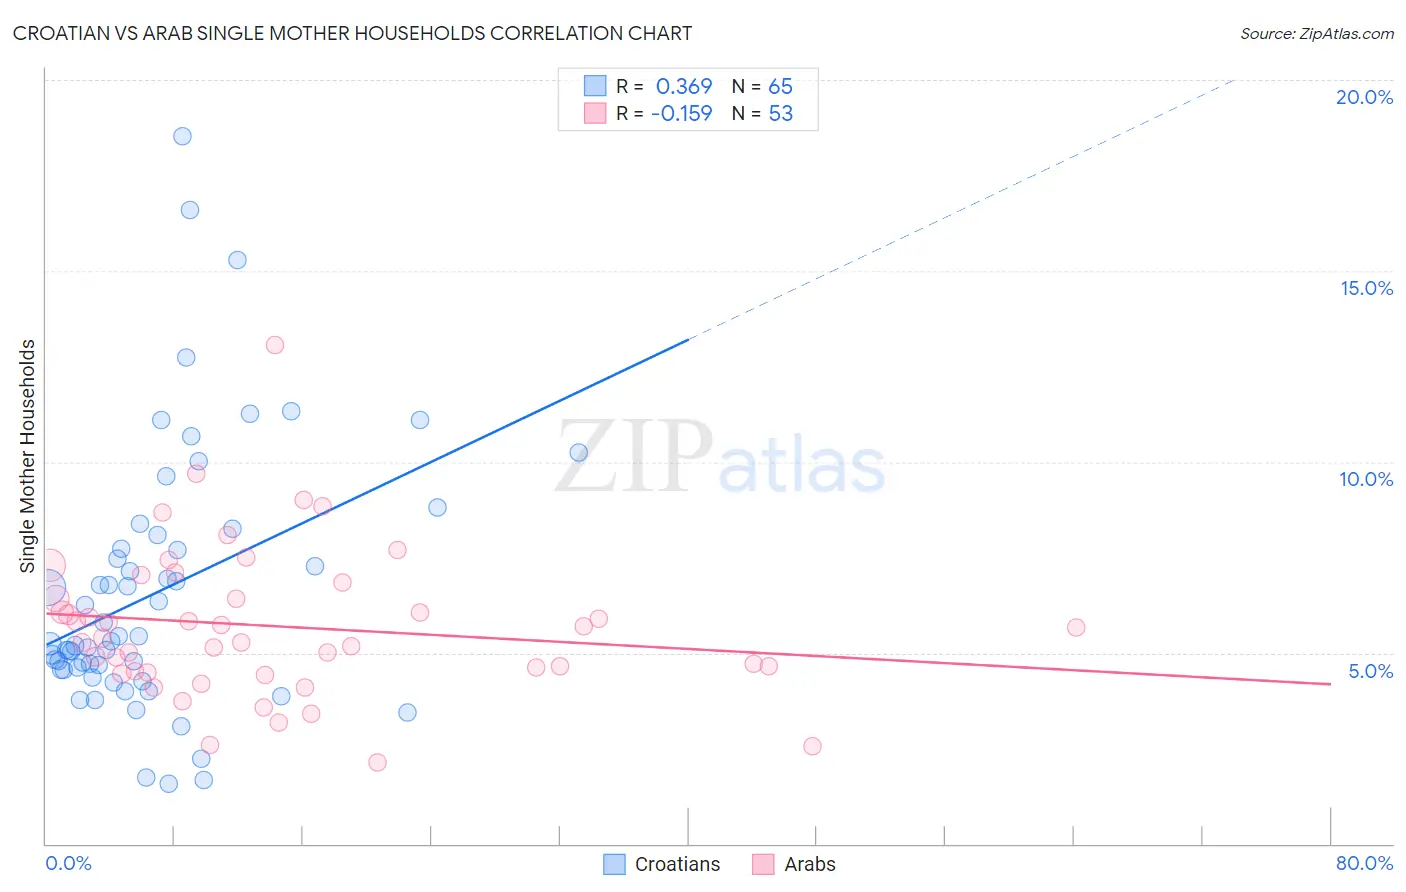
Croatian vs Arab Single Mother Households Correlation Chart

The statistical analysis conducted on geographies consisting of 374,465,881 people shows a mild positive correlation between the proportion of Croatians and percentage of single mother households in the United States with a correlation coefficient (R) of 0.369 and weighted average of 5.5%. Similarly, the statistical analysis conducted on geographies consisting of 484,798,237 people shows a poor negative correlation between the proportion of Arabs and percentage of single mother households in the United States with a correlation coefficient (R) of -0.159 and weighted average of 6.0%, a difference of 10.4%.
Croatian vs Arab Single Mother Households

Single Mother Households Correlation Summary

MeasurementCroatianArab
Minimum1.6%2.1%
Maximum18.5%13.1%
Range16.9%10.9%
Mean6.6%5.7%
Median5.3%5.4%
Interquartile 25% (IQ1)4.6%4.5%
Interquartile 75% (IQ3)7.9%6.6%
Interquartile Range (IQR)3.4%2.1%
Standard Deviation (Sample)3.4%2.0%
Standard Deviation (Population)3.4%1.9%

Similar Demographics by Single Mother Households

Demographics Similar to Croatians by Single Mother Households

In terms of single mother households, the demographic groups most similar to Croatians are Norwegian (5.5%, a difference of 0.18%), Immigrants from Croatia (5.4%, a difference of 0.26%), Lithuanian (5.4%, a difference of 0.38%), Turkish (5.5%, a difference of 0.38%), and Immigrants from Latvia (5.5%, a difference of 0.41%).
DemographicsRating | RankSingle Mother Households
Immigrants | Sweden
99.6
/100
|
#39
Exceptional
5.4%
Estonians
99.6
/100
|
#40
Exceptional
5.4%
Immigrants | Greece
99.5
/100
|
#41
Exceptional
5.4%
Macedonians
99.5
/100
|
#42
Exceptional
5.4%
Immigrants | South Central Asia
99.5
/100
|
#43
Exceptional
5.4%
Lithuanians
99.4
/100
|
#44
Exceptional
5.4%
Immigrants | Croatia
99.4
/100
|
#45
Exceptional
5.4%
Croatians
99.3
/100
|
#46
Exceptional
5.5%
Norwegians
99.3
/100
|
#47
Exceptional
5.5%
Turks
99.2
/100
|
#48
Exceptional
5.5%
Immigrants | Latvia
99.2
/100
|
#49
Exceptional
5.5%
Immigrants | Scotland
99.2
/100
|
#50
Exceptional
5.5%
Immigrants | Belarus
99.2
/100
|
#51
Exceptional
5.5%
Swedes
99.1
/100
|
#52
Exceptional
5.5%
Immigrants | Russia
99.1
/100
|
#53
Exceptional
5.5%

Demographics Similar to Arabs by Single Mother Households

In terms of single mother households, the demographic groups most similar to Arabs are Korean (6.0%, a difference of 0.090%), Immigrants from Iraq (6.0%, a difference of 0.19%), Immigrants from Egypt (6.0%, a difference of 0.23%), Tsimshian (6.0%, a difference of 0.28%), and French Canadian (6.0%, a difference of 0.29%).
DemographicsRating | RankSingle Mother Households
Icelanders
86.9
/100
|
#138
Excellent
6.0%
Syrians
86.0
/100
|
#139
Excellent
6.0%
French
85.7
/100
|
#140
Excellent
6.0%
Tsimshian
85.2
/100
|
#141
Excellent
6.0%
Immigrants | Egypt
85.0
/100
|
#142
Excellent
6.0%
Immigrants | Iraq
84.8
/100
|
#143
Excellent
6.0%
Koreans
84.4
/100
|
#144
Excellent
6.0%
Arabs
84.0
/100
|
#145
Excellent
6.0%
French Canadians
82.6
/100
|
#146
Excellent
6.0%
Immigrants | Jordan
82.3
/100
|
#147
Excellent
6.0%
Scotch-Irish
82.0
/100
|
#148
Excellent
6.0%
Immigrants | Albania
81.5
/100
|
#149
Excellent
6.1%
Zimbabweans
80.7
/100
|
#150
Excellent
6.1%
Immigrants | Southern Europe
80.5
/100
|
#151
Excellent
6.1%
Pakistanis
79.2
/100
|
#152
Good
6.1%