Colville vs Immigrants from Grenada Family Households
COMPARE
Colville
Immigrants from Grenada
Family Households
Family Households Comparison
Colville
Immigrants from Grenada
63.2%
FAMILY HOUSEHOLDS
0.5/ 100
METRIC RATING
265th/ 347
METRIC RANK
62.6%
FAMILY HOUSEHOLDS
0.0/ 100
METRIC RATING
290th/ 347
METRIC RANK
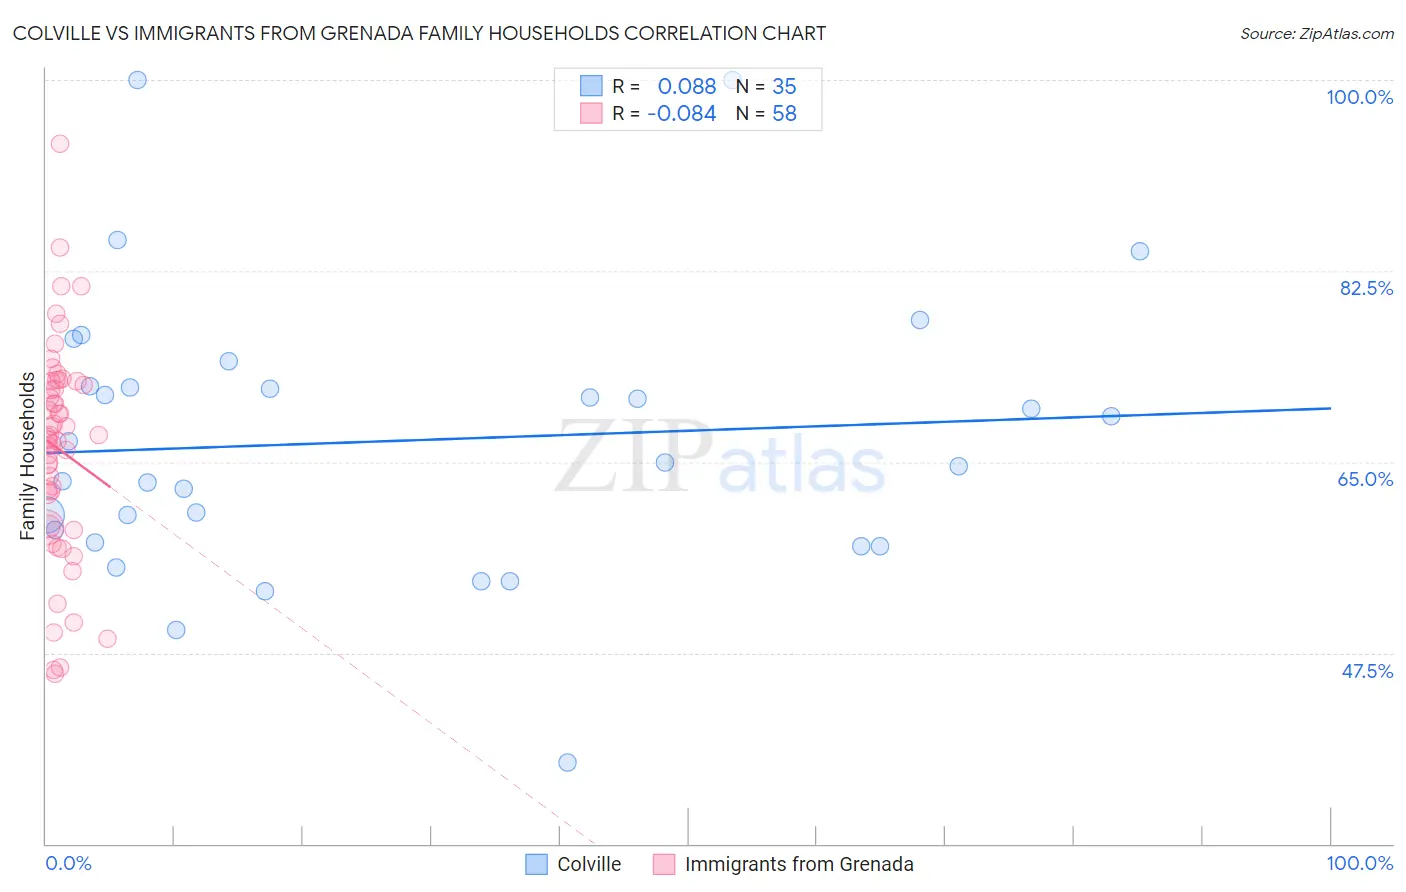
Colville vs Immigrants from Grenada Family Households Correlation Chart
The statistical analysis conducted on geographies consisting of 34,683,092 people shows a slight positive correlation between the proportion of Colville and percentage of family households in the United States with a correlation coefficient (R) of 0.088 and weighted average of 63.2%. Similarly, the statistical analysis conducted on geographies consisting of 67,190,411 people shows a slight negative correlation between the proportion of Immigrants from Grenada and percentage of family households in the United States with a correlation coefficient (R) of -0.084 and weighted average of 62.6%, a difference of 0.81%.
Family Households Correlation Summary
| Measurement | Colville | Immigrants from Grenada |
| Minimum | 37.5% | 45.6% |
| Maximum | 100.0% | 94.1% |
| Range | 62.5% | 48.5% |
| Mean | 66.9% | 66.2% |
| Median | 65.0% | 67.3% |
| Interquartile 25% (IQ1) | 57.6% | 59.1% |
| Interquartile 75% (IQ3) | 72.0% | 72.4% |
| Interquartile Range (IQR) | 14.4% | 13.3% |
| Standard Deviation (Sample) | 12.9% | 9.8% |
| Standard Deviation (Population) | 12.7% | 9.7% |
Similar Demographics by Family Households
Demographics Similar to Colville by Family Households
In terms of family households, the demographic groups most similar to Colville are Kenyan (63.2%, a difference of 0.010%), Immigrants from Western Africa (63.1%, a difference of 0.010%), Cheyenne (63.2%, a difference of 0.020%), Immigrants from Ireland (63.2%, a difference of 0.040%), and Immigrants from Russia (63.2%, a difference of 0.050%).
| Demographics | Rating | Rank | Family Households |
| Immigrants | Barbados | 0.7 /100 | #258 | Tragic 63.2% |
| Immigrants | Western Europe | 0.6 /100 | #259 | Tragic 63.2% |
| Cypriots | 0.6 /100 | #260 | Tragic 63.2% |
| Immigrants | Russia | 0.6 /100 | #261 | Tragic 63.2% |
| Immigrants | Ireland | 0.6 /100 | #262 | Tragic 63.2% |
| Cheyenne | 0.5 /100 | #263 | Tragic 63.2% |
| Kenyans | 0.5 /100 | #264 | Tragic 63.2% |
| Colville | 0.5 /100 | #265 | Tragic 63.2% |
| Immigrants | Western Africa | 0.5 /100 | #266 | Tragic 63.1% |
| Israelis | 0.4 /100 | #267 | Tragic 63.1% |
| Immigrants | Singapore | 0.4 /100 | #268 | Tragic 63.1% |
| Yugoslavians | 0.4 /100 | #269 | Tragic 63.1% |
| Immigrants | Austria | 0.3 /100 | #270 | Tragic 63.1% |
| Immigrants | Croatia | 0.3 /100 | #271 | Tragic 63.1% |
| Immigrants | Turkey | 0.3 /100 | #272 | Tragic 63.1% |
Demographics Similar to Immigrants from Grenada by Family Households
In terms of family households, the demographic groups most similar to Immigrants from Grenada are U.S. Virgin Islander (62.6%, a difference of 0.050%), Immigrants from Nepal (62.7%, a difference of 0.080%), Immigrants from Burma/Myanmar (62.6%, a difference of 0.10%), Immigrants from Uganda (62.7%, a difference of 0.17%), and British West Indian (62.8%, a difference of 0.19%).
| Demographics | Rating | Rank | Family Households |
| Immigrants | Denmark | 0.1 /100 | #283 | Tragic 62.9% |
| Australians | 0.1 /100 | #284 | Tragic 62.8% |
| Mongolians | 0.1 /100 | #285 | Tragic 62.8% |
| British West Indians | 0.1 /100 | #286 | Tragic 62.8% |
| Latvians | 0.1 /100 | #287 | Tragic 62.8% |
| Immigrants | Uganda | 0.1 /100 | #288 | Tragic 62.7% |
| Immigrants | Nepal | 0.1 /100 | #289 | Tragic 62.7% |
| Immigrants | Grenada | 0.0 /100 | #290 | Tragic 62.6% |
| U.S. Virgin Islanders | 0.0 /100 | #291 | Tragic 62.6% |
| Immigrants | Burma/Myanmar | 0.0 /100 | #292 | Tragic 62.6% |
| Immigrants | Sweden | 0.0 /100 | #293 | Tragic 62.5% |
| Barbadians | 0.0 /100 | #294 | Tragic 62.5% |
| Okinawans | 0.0 /100 | #295 | Tragic 62.5% |
| Slovenes | 0.0 /100 | #296 | Tragic 62.4% |
| French American Indians | 0.0 /100 | #297 | Tragic 62.4% |