Central American Indian vs Delaware Births to Unmarried Women

COMPARE

Central American Indian
Race
Ancestry
AfghanAfricanAlaska NativeAlaskan AthabascanAlbanianAleutAlsatianAmericanApacheArabArapahoArgentineanArmenianAssyrian/Chaldean/SyriacAustralianAustrianBahamianBangladeshiBarbadianBasqueBelgianBelizeanBermudanBhutaneseBlackfeetBolivianBrazilianBritishBritish West IndianBulgarianBurmeseCajunCambodianCanadianCape VerdeanCarpatho RusynCelticCentral AmericanCentral American IndianCherokeeCheyenneChickasawChileanChineseChippewaChoctawColombianColvilleComancheCosta RicanCreeCreekCroatianCrowCubanCypriotCzechCzechoslovakianDanishDominicanDutchDutch West IndianEastern EuropeanEcuadorianEgyptianEnglishEstonianEthiopianEuropeanFijianFilipinoFinnishFrenchFrench American IndianFrench CanadianGermanGerman RussianGhanaianGreekGuamanian/ChamorroGuatemalanGuyaneseHaitianHmongHonduranHopiHoumaHungarianIcelanderIndian (Asian)IndonesianInupiatIranianIraqiIrishIroquoisIsraeliItalianJamaicanJapaneseJordanianKenyanKiowaKoreanLaotianLatvianLebaneseLiberianLithuanianLumbeeLuxembourgerMacedonianMalaysianMalteseMarshalleseMenomineeMexicanMexican American IndianMongolianMoroccanNative HawaiianNavajoNepaleseNew ZealanderNicaraguanNigerianNorthern EuropeanNorwegianOkinawanOsageOttawaPaiutePakistaniPalestinianPanamanianParaguayanPennsylvania GermanPeruvianPimaPolishPortuguesePotawatomiPuebloPuerto RicanPuget Sound SalishRomanianRussianSalvadoranSamoanScandinavianScotch-IrishScottishSeminoleSenegaleseSerbianShoshoneSierra LeoneanSiouxSlavicSlovakSloveneSomaliSouth AfricanSouth AmericanSouth American IndianSoviet UnionSpaniardSpanishSpanish AmericanSpanish American IndianSri LankanSubsaharan AfricanSudaneseSwedishSwissSyrianTaiwaneseThaiTlingit-HaidaTohono O'OdhamTonganTrinidadian and TobagonianTsimshianTurkishU.S. Virgin IslanderUgandanUkrainianUruguayanUteVenezuelanVietnameseWelshWest IndianYakamaYaquiYugoslavianYumanYup'ikZimbabwean
Immigration
NonimmigrantsImmigrantsAfghanistanAfricaAlbaniaArgentinaArmeniaAsiaAustraliaAustriaBahamasBangladeshBarbadosBelarusBelgiumBelizeBoliviaBosnia and HerzegovinaBrazilBulgariaBurma/MyanmarCabo VerdeCambodiaCameroonCanadaCaribbeanCentral AmericaChileChinaColombiaCongoCosta RicaCroatiaCubaCzechoslovakiaDenmarkDominicaDominican RepublicEastern AfricaEastern AsiaEastern EuropeEcuadorEgyptEl SalvadorEnglandEritreaEthiopiaEuropeFijiFranceGermanyGhanaGreeceGrenadaGuatemalaGuyanaHaitiHondurasHong KongHungaryIndiaIndonesiaIranIraqIrelandIsraelItalyJamaicaJapanJordanKazakhstanKenyaKoreaKuwaitLaosLatin AmericaLatviaLebanonLiberiaLithuaniaMalaysiaMexicoMicronesiaMiddle AfricaMoldovaMoroccoNepalNetherlandsNicaraguaNigeriaNorth AmericaNorth MacedoniaNorthern AfricaNorthern EuropeNorwayOceaniaPakistanPanamaPeruPhilippinesPolandPortugalRomaniaRussiaSaudi ArabiaScotlandSenegalSerbiaSierra LeoneSingaporeSomaliaSouth AfricaSouth AmericaSouth Central AsiaSouth Eastern AsiaSouthern EuropeSpainSri LankaSt. Vincent and the GrenadinesSudanSwedenSwitzerlandSyriaTaiwanThailandTrinidad and TobagoTurkeyUgandaUkraineUruguayUzbekistanVenezuelaVietnamWest IndiesWestern AfricaWestern AsiaWestern EuropeYemenZaireZimbabweAzores
Delaware
Race
Ancestry
AfghanAfricanAlaska NativeAlaskan AthabascanAlbanianAleutAlsatianAmericanApacheArabArapahoArgentineanArmenianAssyrian/Chaldean/SyriacAustralianAustrianBahamianBangladeshiBarbadianBasqueBelgianBelizeanBermudanBhutaneseBlackfeetBolivianBrazilianBritishBritish West IndianBulgarianBurmeseCajunCambodianCanadianCape VerdeanCarpatho RusynCelticCentral AmericanCherokeeCheyenneChickasawChileanChineseChippewaChoctawColombianColvilleComancheCosta RicanCreeCreekCroatianCrowCubanCypriotCzechCzechoslovakianDanishDelawareDominicanDutchDutch West IndianEastern EuropeanEcuadorianEgyptianEnglishEstonianEthiopianEuropeanFijianFilipinoFinnishFrenchFrench American IndianFrench CanadianGermanGerman RussianGhanaianGreekGuamanian/ChamorroGuatemalanGuyaneseHaitianHmongHonduranHopiHoumaHungarianIcelanderIndian (Asian)IndonesianInupiatIranianIraqiIrishIroquoisIsraeliItalianJamaicanJapaneseJordanianKenyanKiowaKoreanLaotianLatvianLebaneseLiberianLithuanianLumbeeLuxembourgerMacedonianMalaysianMalteseMarshalleseMenomineeMexicanMexican American IndianMongolianMoroccanNative HawaiianNavajoNepaleseNew ZealanderNicaraguanNigerianNorthern EuropeanNorwegianOkinawanOsageOttawaPaiutePakistaniPalestinianPanamanianParaguayanPennsylvania GermanPeruvianPimaPolishPortuguesePotawatomiPuebloPuerto RicanPuget Sound SalishRomanianRussianSalvadoranSamoanScandinavianScotch-IrishScottishSeminoleSenegaleseSerbianShoshoneSierra LeoneanSiouxSlavicSlovakSloveneSomaliSouth AfricanSouth AmericanSouth American IndianSoviet UnionSpaniardSpanishSpanish AmericanSpanish American IndianSri LankanSubsaharan AfricanSudaneseSwedishSwissSyrianTaiwaneseThaiTlingit-HaidaTohono O'OdhamTonganTrinidadian and TobagonianTsimshianTurkishU.S. Virgin IslanderUgandanUkrainianUruguayanUteVenezuelanVietnameseWelshWest IndianYakamaYaquiYugoslavianYumanYup'ikZimbabwean
Immigration
NonimmigrantsImmigrantsAfghanistanAfricaAlbaniaArgentinaArmeniaAsiaAustraliaAustriaBahamasBangladeshBarbadosBelarusBelgiumBelizeBoliviaBosnia and HerzegovinaBrazilBulgariaBurma/MyanmarCabo VerdeCambodiaCameroonCanadaCaribbeanCentral AmericaChileChinaColombiaCongoCosta RicaCroatiaCubaCzechoslovakiaDenmarkDominicaDominican RepublicEastern AfricaEastern AsiaEastern EuropeEcuadorEgyptEl SalvadorEnglandEritreaEthiopiaEuropeFijiFranceGermanyGhanaGreeceGrenadaGuatemalaGuyanaHaitiHondurasHong KongHungaryIndiaIndonesiaIranIraqIrelandIsraelItalyJamaicaJapanJordanKazakhstanKenyaKoreaKuwaitLaosLatin AmericaLatviaLebanonLiberiaLithuaniaMalaysiaMexicoMicronesiaMiddle AfricaMoldovaMoroccoNepalNetherlandsNicaraguaNigeriaNorth AmericaNorth MacedoniaNorthern AfricaNorthern EuropeNorwayOceaniaPakistanPanamaPeruPhilippinesPolandPortugalRomaniaRussiaSaudi ArabiaScotlandSenegalSerbiaSierra LeoneSingaporeSomaliaSouth AfricaSouth AmericaSouth Central AsiaSouth Eastern AsiaSouthern EuropeSpainSri LankaSt. Vincent and the GrenadinesSudanSwedenSwitzerlandSyriaTaiwanThailandTrinidad and TobagoTurkeyUgandaUkraineUruguayUzbekistanVenezuelaVietnamWest IndiesWestern AfricaWestern AsiaWestern EuropeYemenZaireZimbabweAzores
Births to Unmarried Women
Income
Poverty
Unemployment
Labor Participation
Family Structure
Vehicle Availability
Education Level
Disability

Births to Unmarried Women Comparison

Central American Indians

Delaware

Tragic
Tragic
39.0%
BIRTHS TO UNMARRIED WOMEN
0.0/ 100
METRIC RATING
306th/ 347
METRIC RANK
34.2%
BIRTHS TO UNMARRIED WOMEN
3.3/ 100
METRIC RATING
226th/ 347
METRIC RANK

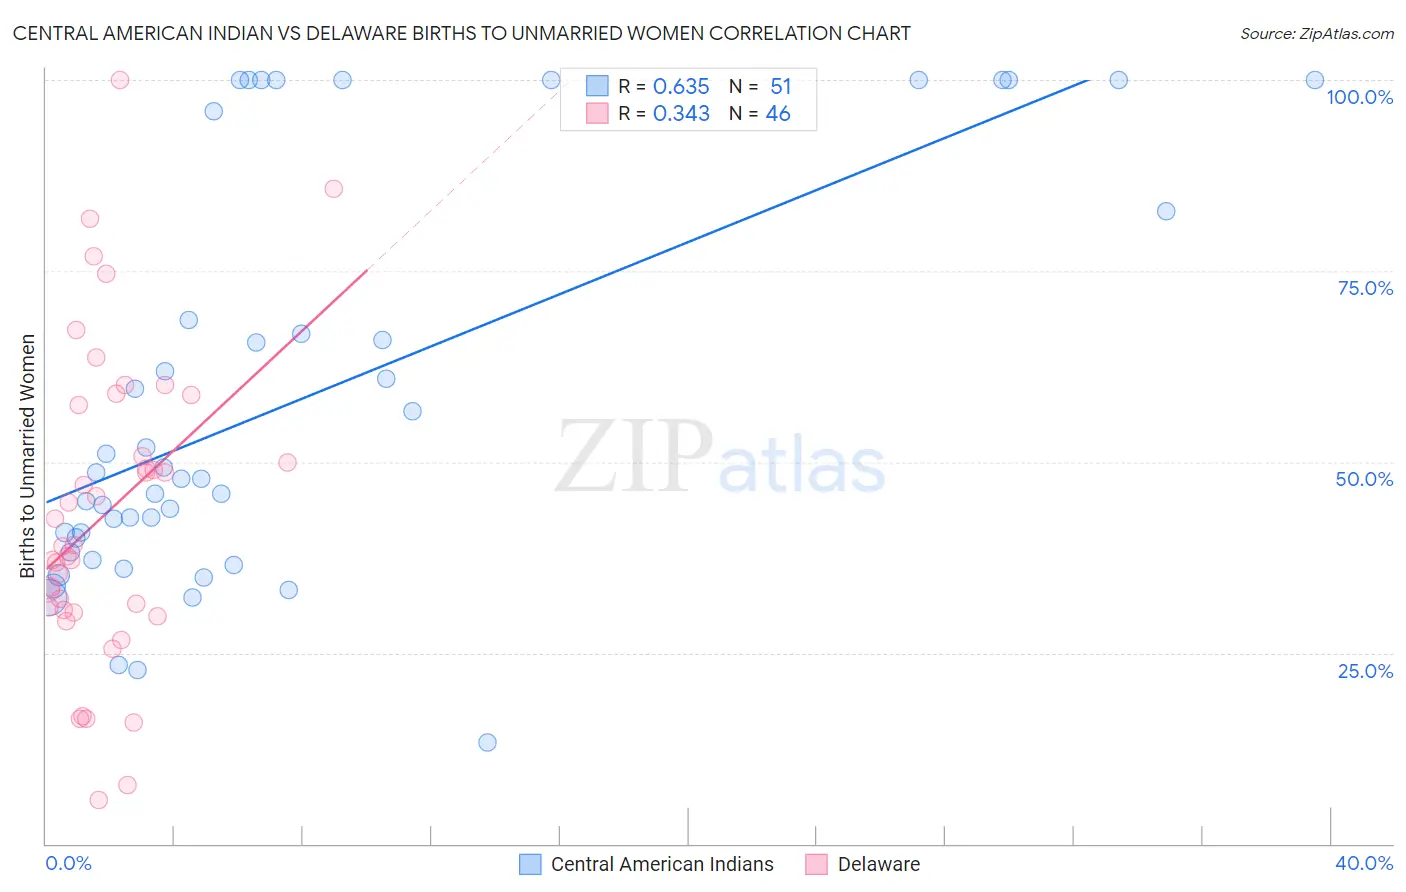
Central American Indian vs Delaware Births to Unmarried Women Correlation Chart

The statistical analysis conducted on geographies consisting of 312,295,500 people shows a significant positive correlation between the proportion of Central American Indians and percentage of births to unmarried women in the United States with a correlation coefficient (R) of 0.635 and weighted average of 39.0%. Similarly, the statistical analysis conducted on geographies consisting of 93,888,515 people shows a mild positive correlation between the proportion of Delaware and percentage of births to unmarried women in the United States with a correlation coefficient (R) of 0.343 and weighted average of 34.2%, a difference of 14.0%.
Central American Indian vs Delaware Births to Unmarried Women

Births to Unmarried Women Correlation Summary

MeasurementCentral American IndianDelaware
Minimum13.2%5.8%
Maximum100.0%100.0%
Range86.8%94.2%
Mean58.1%43.4%
Median47.9%39.0%
Interquartile 25% (IQ1)38.2%30.6%
Interquartile 75% (IQ3)82.8%57.4%
Interquartile Range (IQR)44.6%26.8%
Standard Deviation (Sample)26.3%20.5%
Standard Deviation (Population)26.0%20.2%

Similar Demographics by Births to Unmarried Women

Demographics Similar to Central American Indians by Births to Unmarried Women

In terms of births to unmarried women, the demographic groups most similar to Central American Indians are Immigrants from Haiti (38.9%, a difference of 0.29%), Yaqui (38.8%, a difference of 0.39%), Immigrants from Jamaica (38.8%, a difference of 0.44%), Honduran (38.7%, a difference of 0.76%), and Immigrants from Honduras (39.3%, a difference of 0.86%).
DemographicsRating | RankBirths to Unmarried Women
Spanish Americans
0.0
/100
|
#299
Tragic
38.6%
Immigrants | West Indies
0.0
/100
|
#300
Tragic
38.6%
Haitians
0.0
/100
|
#301
Tragic
38.6%
Hondurans
0.0
/100
|
#302
Tragic
38.7%
Immigrants | Jamaica
0.0
/100
|
#303
Tragic
38.8%
Yaqui
0.0
/100
|
#304
Tragic
38.8%
Immigrants | Haiti
0.0
/100
|
#305
Tragic
38.9%
Central American Indians
0.0
/100
|
#306
Tragic
39.0%
Immigrants | Honduras
0.0
/100
|
#307
Tragic
39.3%
Aleuts
0.0
/100
|
#308
Tragic
39.3%
Cubans
0.0
/100
|
#309
Tragic
39.4%
Immigrants | Dominica
0.0
/100
|
#310
Tragic
39.5%
Immigrants | Azores
0.0
/100
|
#311
Tragic
39.6%
U.S. Virgin Islanders
0.0
/100
|
#312
Tragic
39.6%
Africans
0.0
/100
|
#313
Tragic
39.7%

Demographics Similar to Delaware by Births to Unmarried Women

In terms of births to unmarried women, the demographic groups most similar to Delaware are Immigrants from Panama (34.2%, a difference of 0.010%), Panamanian (34.2%, a difference of 0.050%), Immigrants from Sierra Leone (34.2%, a difference of 0.16%), Ghanaian (34.3%, a difference of 0.18%), and Native Hawaiian (34.3%, a difference of 0.32%).
DemographicsRating | RankBirths to Unmarried Women
Alsatians
5.4
/100
|
#219
Tragic
33.8%
Portuguese
5.4
/100
|
#220
Tragic
33.8%
Malaysians
5.0
/100
|
#221
Tragic
33.9%
Immigrants | Uruguay
4.8
/100
|
#222
Tragic
33.9%
Pennsylvania Germans
4.3
/100
|
#223
Tragic
34.0%
Immigrants | Laos
4.3
/100
|
#224
Tragic
34.0%
Spanish
4.0
/100
|
#225
Tragic
34.1%
Delaware
3.3
/100
|
#226
Tragic
34.2%
Immigrants | Panama
3.3
/100
|
#227
Tragic
34.2%
Panamanians
3.3
/100
|
#228
Tragic
34.2%
Immigrants | Sierra Leone
3.1
/100
|
#229
Tragic
34.2%
Ghanaians
3.1
/100
|
#230
Tragic
34.3%
Native Hawaiians
2.9
/100
|
#231
Tragic
34.3%
French Canadians
2.5
/100
|
#232
Tragic
34.4%
Bangladeshis
2.5
/100
|
#233
Tragic
34.4%