Celtic vs Immigrants from Iran Family Households
COMPARE
Celtic
Immigrants from Iran
Family Households
Family Households Comparison
Celtics
Immigrants from Iran
63.8%
FAMILY HOUSEHOLDS
8.0/ 100
METRIC RATING
214th/ 347
METRIC RANK
64.1%
FAMILY HOUSEHOLDS
30.4/ 100
METRIC RATING
185th/ 347
METRIC RANK
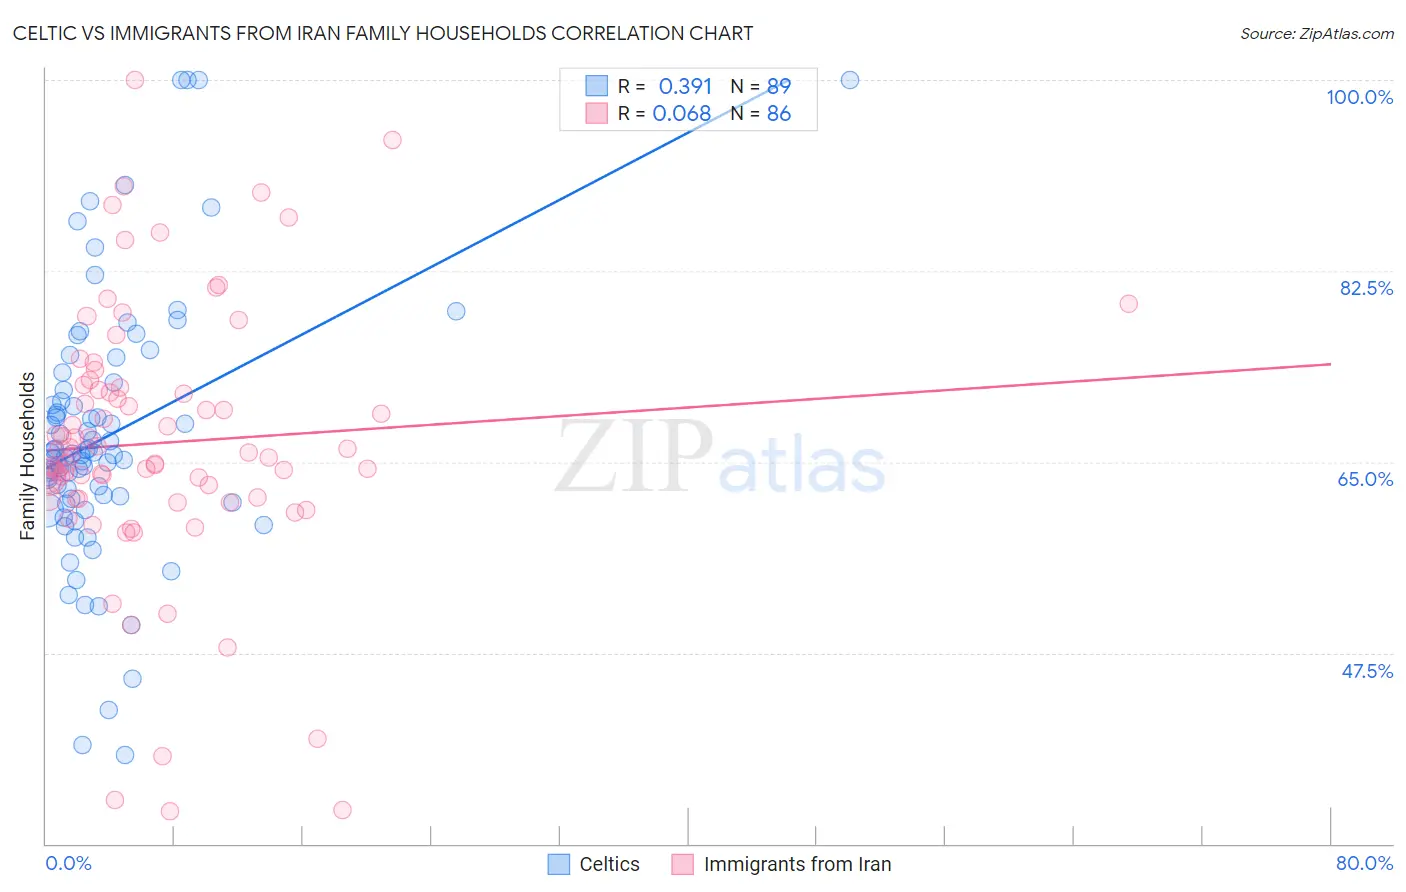
Celtic vs Immigrants from Iran Family Households Correlation Chart
The statistical analysis conducted on geographies consisting of 168,846,430 people shows a mild positive correlation between the proportion of Celtics and percentage of family households in the United States with a correlation coefficient (R) of 0.391 and weighted average of 63.8%. Similarly, the statistical analysis conducted on geographies consisting of 279,831,456 people shows a slight positive correlation between the proportion of Immigrants from Iran and percentage of family households in the United States with a correlation coefficient (R) of 0.068 and weighted average of 64.1%, a difference of 0.55%.
Family Households Correlation Summary
| Measurement | Celtic | Immigrants from Iran |
| Minimum | 38.1% | 33.0% |
| Maximum | 100.0% | 100.0% |
| Range | 61.9% | 67.0% |
| Mean | 67.4% | 66.7% |
| Median | 65.8% | 65.7% |
| Interquartile 25% (IQ1) | 61.4% | 61.7% |
| Interquartile 75% (IQ3) | 71.9% | 71.8% |
| Interquartile Range (IQR) | 10.5% | 10.2% |
| Standard Deviation (Sample) | 12.1% | 12.3% |
| Standard Deviation (Population) | 12.0% | 12.3% |
Similar Demographics by Family Households
Demographics Similar to Celtics by Family Households
In terms of family households, the demographic groups most similar to Celtics are Belgian (63.8%, a difference of 0.020%), Croatian (63.8%, a difference of 0.030%), Immigrants from Northern Europe (63.8%, a difference of 0.040%), Osage (63.7%, a difference of 0.050%), and Marshallese (63.7%, a difference of 0.050%).
| Demographics | Rating | Rank | Family Households |
| Nigerians | 11.5 /100 | #207 | Poor 63.9% |
| Immigrants | Bangladesh | 11.4 /100 | #208 | Poor 63.9% |
| Sierra Leoneans | 11.2 /100 | #209 | Poor 63.9% |
| Immigrants | Thailand | 9.6 /100 | #210 | Tragic 63.8% |
| Shoshone | 9.4 /100 | #211 | Tragic 63.8% |
| Immigrants | Netherlands | 9.4 /100 | #212 | Tragic 63.8% |
| Immigrants | Northern Europe | 8.8 /100 | #213 | Tragic 63.8% |
| Celtics | 8.0 /100 | #214 | Tragic 63.8% |
| Belgians | 7.6 /100 | #215 | Tragic 63.8% |
| Croatians | 7.3 /100 | #216 | Tragic 63.8% |
| Osage | 7.0 /100 | #217 | Tragic 63.7% |
| Marshallese | 6.9 /100 | #218 | Tragic 63.7% |
| Macedonians | 6.5 /100 | #219 | Tragic 63.7% |
| Immigrants | Europe | 6.4 /100 | #220 | Tragic 63.7% |
| Immigrants | South Africa | 5.9 /100 | #221 | Tragic 63.7% |
Demographics Similar to Immigrants from Iran by Family Households
In terms of family households, the demographic groups most similar to Immigrants from Iran are Spanish American (64.1%, a difference of 0.010%), Northern European (64.1%, a difference of 0.040%), Puerto Rican (64.2%, a difference of 0.050%), Ukrainian (64.2%, a difference of 0.060%), and Creek (64.2%, a difference of 0.060%).
| Demographics | Rating | Rank | Family Households |
| Jamaicans | 40.6 /100 | #178 | Average 64.2% |
| Immigrants | Ukraine | 38.2 /100 | #179 | Fair 64.2% |
| Immigrants | Honduras | 35.0 /100 | #180 | Fair 64.2% |
| Immigrants | Trinidad and Tobago | 34.9 /100 | #181 | Fair 64.2% |
| Ukrainians | 34.6 /100 | #182 | Fair 64.2% |
| Creek | 34.1 /100 | #183 | Fair 64.2% |
| Puerto Ricans | 33.4 /100 | #184 | Fair 64.2% |
| Immigrants | Iran | 30.4 /100 | #185 | Fair 64.1% |
| Spanish Americans | 30.1 /100 | #186 | Fair 64.1% |
| Northern Europeans | 28.2 /100 | #187 | Fair 64.1% |
| Paraguayans | 26.7 /100 | #188 | Fair 64.1% |
| Immigrants | Western Asia | 25.3 /100 | #189 | Fair 64.1% |
| Zimbabweans | 24.7 /100 | #190 | Fair 64.1% |
| Arabs | 24.5 /100 | #191 | Fair 64.1% |
| Lithuanians | 23.8 /100 | #192 | Fair 64.0% |