Canadian vs Immigrants from Eastern Europe Births to Unmarried Women
COMPARE
Canadian
Immigrants from Eastern Europe
Births to Unmarried Women
Births to Unmarried Women Comparison
Canadians
Immigrants from Eastern Europe
31.9%
BIRTHS TO UNMARRIED WOMEN
41.4/ 100
METRIC RATING
183rd/ 347
METRIC RANK
27.6%
BIRTHS TO UNMARRIED WOMEN
99.6/ 100
METRIC RATING
42nd/ 347
METRIC RANK
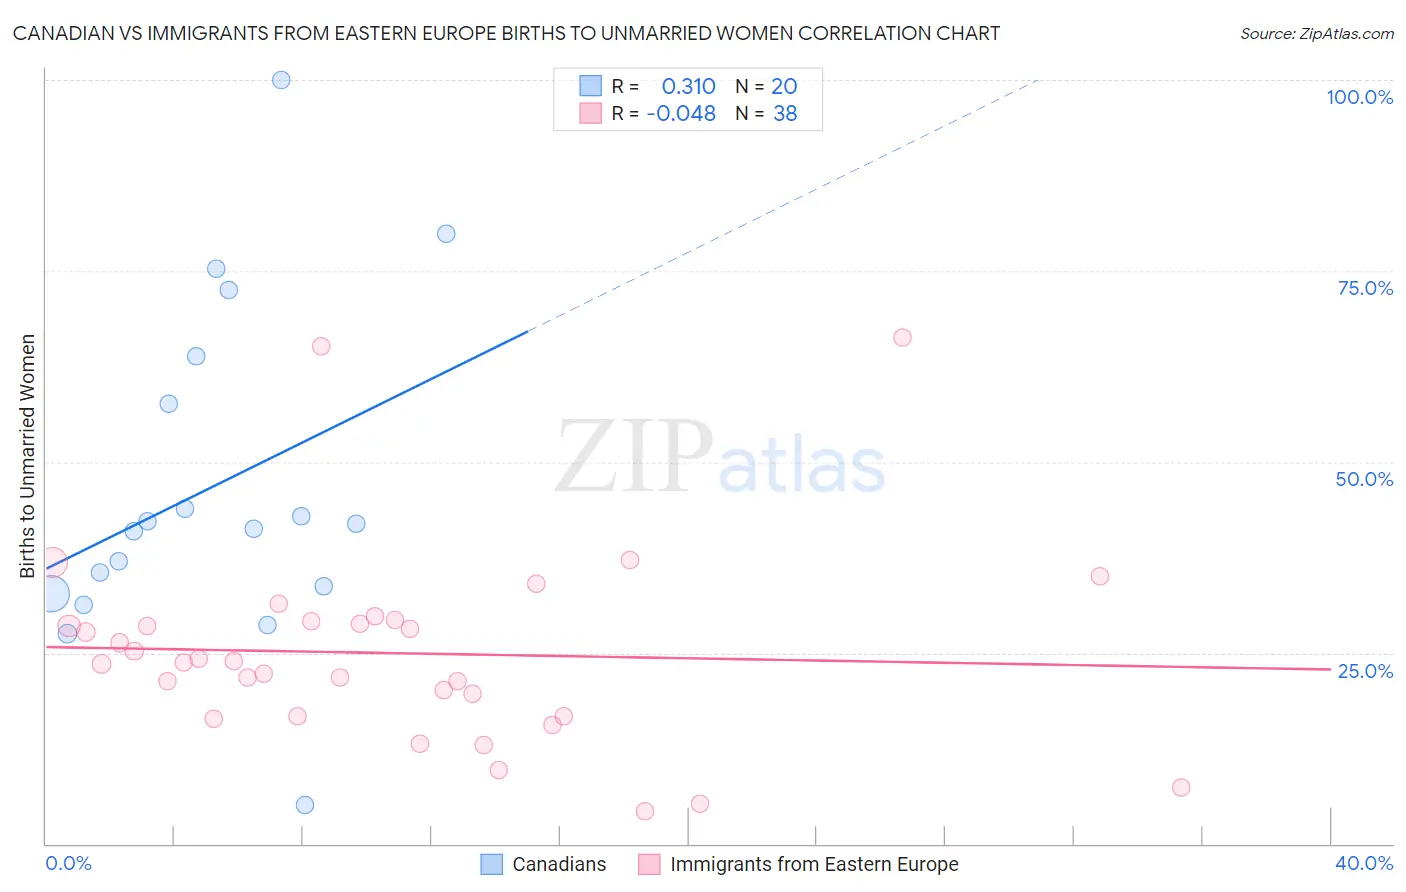
Canadian vs Immigrants from Eastern Europe Births to Unmarried Women Correlation Chart
The statistical analysis conducted on geographies consisting of 401,938,228 people shows a mild positive correlation between the proportion of Canadians and percentage of births to unmarried women in the United States with a correlation coefficient (R) of 0.310 and weighted average of 31.9%. Similarly, the statistical analysis conducted on geographies consisting of 434,188,066 people shows no correlation between the proportion of Immigrants from Eastern Europe and percentage of births to unmarried women in the United States with a correlation coefficient (R) of -0.048 and weighted average of 27.6%, a difference of 15.8%.
Births to Unmarried Women Correlation Summary
| Measurement | Canadian | Immigrants from Eastern Europe |
| Minimum | 5.0% | 4.2% |
| Maximum | 100.0% | 66.3% |
| Range | 95.0% | 62.1% |
| Mean | 46.7% | 25.0% |
| Median | 41.6% | 23.8% |
| Interquartile 25% (IQ1) | 33.2% | 16.7% |
| Interquartile 75% (IQ3) | 60.7% | 29.2% |
| Interquartile Range (IQR) | 27.6% | 12.5% |
| Standard Deviation (Sample) | 22.0% | 12.8% |
| Standard Deviation (Population) | 21.5% | 12.6% |
Similar Demographics by Births to Unmarried Women
Demographics Similar to Canadians by Births to Unmarried Women
In terms of births to unmarried women, the demographic groups most similar to Canadians are Immigrants from South America (32.0%, a difference of 0.070%), Kenyan (31.9%, a difference of 0.16%), German (32.0%, a difference of 0.18%), Welsh (32.0%, a difference of 0.31%), and Czechoslovakian (32.0%, a difference of 0.33%).
| Demographics | Rating | Rank | Births to Unmarried Women |
| Scottish | 48.1 /100 | #176 | Average 31.7% |
| South American Indians | 47.7 /100 | #177 | Average 31.7% |
| English | 47.4 /100 | #178 | Average 31.7% |
| South Americans | 46.9 /100 | #179 | Average 31.8% |
| Moroccans | 45.7 /100 | #180 | Average 31.8% |
| Immigrants | Peru | 45.1 /100 | #181 | Average 31.8% |
| Kenyans | 43.0 /100 | #182 | Average 31.9% |
| Canadians | 41.4 /100 | #183 | Average 31.9% |
| Immigrants | South America | 40.7 /100 | #184 | Average 32.0% |
| Germans | 39.5 /100 | #185 | Fair 32.0% |
| Welsh | 38.2 /100 | #186 | Fair 32.0% |
| Czechoslovakians | 38.0 /100 | #187 | Fair 32.0% |
| Osage | 37.1 /100 | #188 | Fair 32.1% |
| Immigrants | Kenya | 36.9 /100 | #189 | Fair 32.1% |
| Tlingit-Haida | 32.6 /100 | #190 | Fair 32.2% |
Demographics Similar to Immigrants from Eastern Europe by Births to Unmarried Women
In terms of births to unmarried women, the demographic groups most similar to Immigrants from Eastern Europe are Iraqi (27.6%, a difference of 0.020%), Immigrants from Bulgaria (27.6%, a difference of 0.23%), Turkish (27.4%, a difference of 0.43%), Immigrants from Indonesia (27.7%, a difference of 0.49%), and Latvian (27.7%, a difference of 0.58%).
| Demographics | Rating | Rank | Births to Unmarried Women |
| Immigrants | Ireland | 99.7 /100 | #35 | Exceptional 27.2% |
| Immigrants | Western Asia | 99.7 /100 | #36 | Exceptional 27.2% |
| Immigrants | Ukraine | 99.7 /100 | #37 | Exceptional 27.2% |
| Immigrants | Moldova | 99.7 /100 | #38 | Exceptional 27.3% |
| Immigrants | Malaysia | 99.7 /100 | #39 | Exceptional 27.4% |
| Turks | 99.6 /100 | #40 | Exceptional 27.4% |
| Iraqis | 99.6 /100 | #41 | Exceptional 27.6% |
| Immigrants | Eastern Europe | 99.6 /100 | #42 | Exceptional 27.6% |
| Immigrants | Bulgaria | 99.6 /100 | #43 | Exceptional 27.6% |
| Immigrants | Indonesia | 99.5 /100 | #44 | Exceptional 27.7% |
| Latvians | 99.5 /100 | #45 | Exceptional 27.7% |
| Immigrants | Lithuania | 99.5 /100 | #46 | Exceptional 27.7% |
| Hmong | 99.5 /100 | #47 | Exceptional 27.7% |
| Eastern Europeans | 99.5 /100 | #48 | Exceptional 27.7% |
| Immigrants | Greece | 99.4 /100 | #49 | Exceptional 27.8% |