Basque vs U.S. Virgin Islander Family Households
COMPARE
Basque
U.S. Virgin Islander
Family Households
Family Households Comparison
Basques
U.S. Virgin Islanders
64.7%
FAMILY HOUSEHOLDS
85.5/ 100
METRIC RATING
138th/ 347
METRIC RANK
62.6%
FAMILY HOUSEHOLDS
0.0/ 100
METRIC RATING
291st/ 347
METRIC RANK
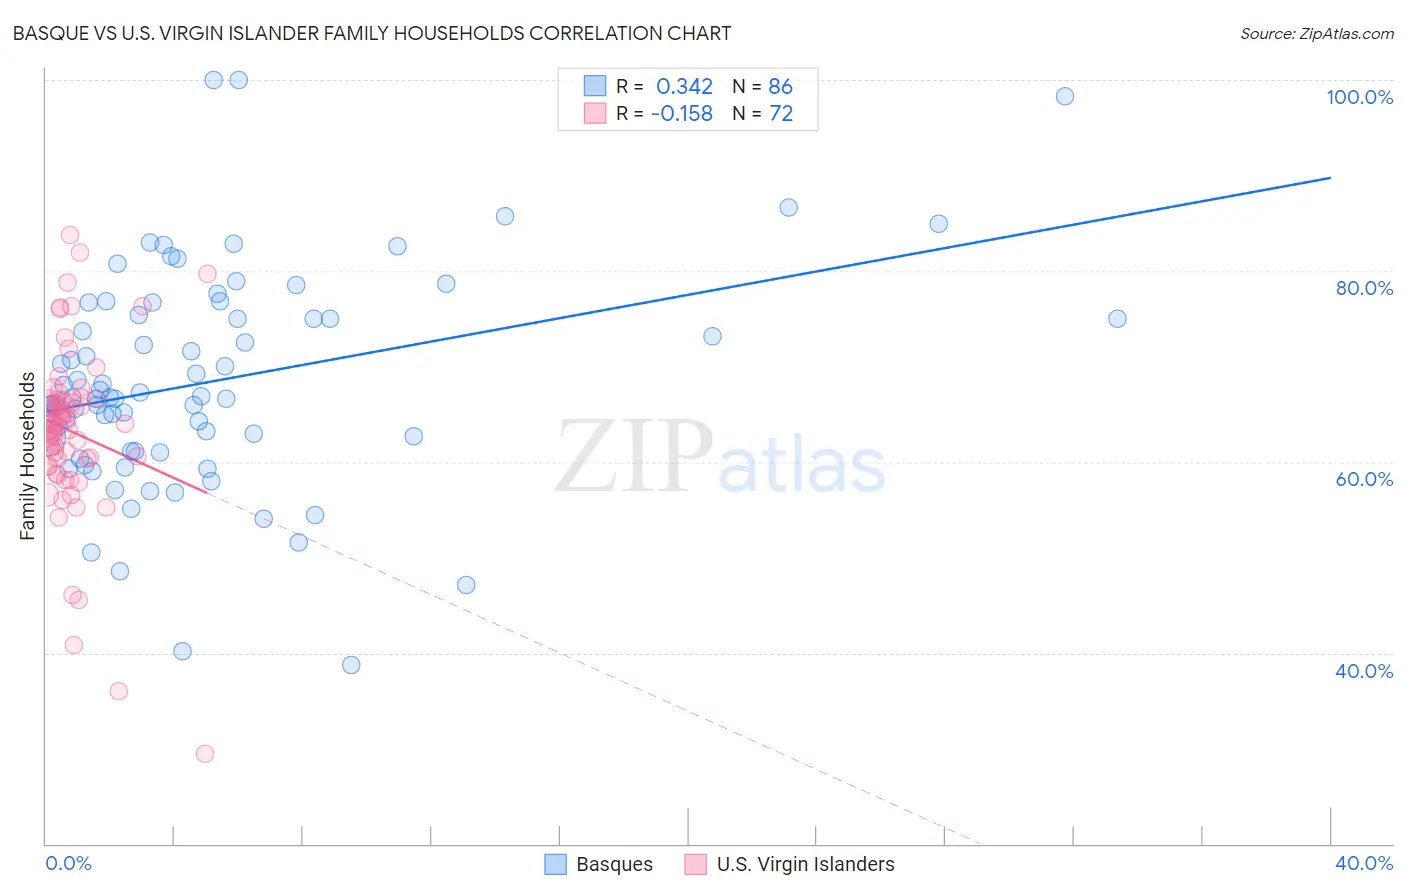
Basque vs U.S. Virgin Islander Family Households Correlation Chart
The statistical analysis conducted on geographies consisting of 165,752,297 people shows a mild positive correlation between the proportion of Basques and percentage of family households in the United States with a correlation coefficient (R) of 0.342 and weighted average of 64.7%. Similarly, the statistical analysis conducted on geographies consisting of 87,507,759 people shows a poor negative correlation between the proportion of U.S. Virgin Islanders and percentage of family households in the United States with a correlation coefficient (R) of -0.158 and weighted average of 62.6%, a difference of 3.3%.
Family Households Correlation Summary
| Measurement | Basque | U.S. Virgin Islander |
| Minimum | 38.8% | 29.5% |
| Maximum | 100.0% | 83.8% |
| Range | 61.2% | 54.3% |
| Mean | 68.5% | 63.2% |
| Median | 66.7% | 63.9% |
| Interquartile 25% (IQ1) | 61.1% | 59.9% |
| Interquartile 75% (IQ3) | 75.3% | 66.5% |
| Interquartile Range (IQR) | 14.3% | 6.6% |
| Standard Deviation (Sample) | 11.5% | 9.1% |
| Standard Deviation (Population) | 11.4% | 9.1% |
Similar Demographics by Family Households
Demographics Similar to Basques by Family Households
In terms of family households, the demographic groups most similar to Basques are Immigrants from Jamaica (64.7%, a difference of 0.010%), Immigrants from Scotland (64.7%, a difference of 0.020%), Immigrants from North Macedonia (64.7%, a difference of 0.020%), Immigrants from Cameroon (64.7%, a difference of 0.020%), and Immigrants from China (64.7%, a difference of 0.030%).
| Demographics | Rating | Rank | Family Households |
| Immigrants | Nonimmigrants | 90.1 /100 | #131 | Exceptional 64.8% |
| Cajuns | 89.4 /100 | #132 | Excellent 64.8% |
| Belizeans | 89.3 /100 | #133 | Excellent 64.8% |
| Greeks | 88.1 /100 | #134 | Excellent 64.7% |
| Maltese | 87.4 /100 | #135 | Excellent 64.7% |
| Immigrants | China | 86.6 /100 | #136 | Excellent 64.7% |
| Immigrants | Scotland | 86.4 /100 | #137 | Excellent 64.7% |
| Basques | 85.5 /100 | #138 | Excellent 64.7% |
| Immigrants | Jamaica | 85.3 /100 | #139 | Excellent 64.7% |
| Immigrants | North Macedonia | 84.9 /100 | #140 | Excellent 64.7% |
| Immigrants | Cameroon | 84.8 /100 | #141 | Excellent 64.7% |
| Pakistanis | 84.0 /100 | #142 | Excellent 64.7% |
| Czechoslovakians | 82.1 /100 | #143 | Excellent 64.6% |
| South American Indians | 81.9 /100 | #144 | Excellent 64.6% |
| Welsh | 80.1 /100 | #145 | Excellent 64.6% |
Demographics Similar to U.S. Virgin Islanders by Family Households
In terms of family households, the demographic groups most similar to U.S. Virgin Islanders are Immigrants from Grenada (62.6%, a difference of 0.050%), Immigrants from Burma/Myanmar (62.6%, a difference of 0.050%), Immigrants from Nepal (62.7%, a difference of 0.13%), Immigrants from Sweden (62.5%, a difference of 0.18%), and Immigrants from Uganda (62.7%, a difference of 0.22%).
| Demographics | Rating | Rank | Family Households |
| Australians | 0.1 /100 | #284 | Tragic 62.8% |
| Mongolians | 0.1 /100 | #285 | Tragic 62.8% |
| British West Indians | 0.1 /100 | #286 | Tragic 62.8% |
| Latvians | 0.1 /100 | #287 | Tragic 62.8% |
| Immigrants | Uganda | 0.1 /100 | #288 | Tragic 62.7% |
| Immigrants | Nepal | 0.1 /100 | #289 | Tragic 62.7% |
| Immigrants | Grenada | 0.0 /100 | #290 | Tragic 62.6% |
| U.S. Virgin Islanders | 0.0 /100 | #291 | Tragic 62.6% |
| Immigrants | Burma/Myanmar | 0.0 /100 | #292 | Tragic 62.6% |
| Immigrants | Sweden | 0.0 /100 | #293 | Tragic 62.5% |
| Barbadians | 0.0 /100 | #294 | Tragic 62.5% |
| Okinawans | 0.0 /100 | #295 | Tragic 62.5% |
| Slovenes | 0.0 /100 | #296 | Tragic 62.4% |
| French American Indians | 0.0 /100 | #297 | Tragic 62.4% |
| Immigrants | Spain | 0.0 /100 | #298 | Tragic 62.4% |