Barbadian vs Immigrants from Lebanon Family Households with Children

COMPARE

Barbadian
Race
Ancestry
AfghanAfricanAlaska NativeAlaskan AthabascanAlbanianAleutAlsatianAmericanApacheArabArapahoArgentineanArmenianAssyrian/Chaldean/SyriacAustralianAustrianBahamianBangladeshiBarbadianBasqueBelgianBelizeanBermudanBhutaneseBlackfeetBolivianBrazilianBritishBritish West IndianBulgarianBurmeseCajunCambodianCanadianCape VerdeanCarpatho RusynCelticCentral AmericanCentral American IndianCherokeeCheyenneChickasawChileanChineseChippewaChoctawColombianColvilleComancheCosta RicanCreeCreekCroatianCrowCubanCypriotCzechCzechoslovakianDanishDelawareDominicanDutchDutch West IndianEastern EuropeanEcuadorianEgyptianEnglishEstonianEthiopianEuropeanFijianFilipinoFinnishFrenchFrench American IndianFrench CanadianGermanGerman RussianGhanaianGreekGuamanian/ChamorroGuatemalanGuyaneseHaitianHmongHonduranHopiHoumaHungarianIcelanderIndian (Asian)IndonesianInupiatIranianIraqiIrishIroquoisIsraeliItalianJamaicanJapaneseJordanianKenyanKiowaKoreanLaotianLatvianLebaneseLiberianLithuanianLumbeeLuxembourgerMacedonianMalaysianMalteseMarshalleseMenomineeMexicanMexican American IndianMongolianMoroccanNative HawaiianNavajoNepaleseNew ZealanderNicaraguanNigerianNorthern EuropeanNorwegianOkinawanOsageOttawaPaiutePakistaniPalestinianPanamanianParaguayanPennsylvania GermanPeruvianPimaPolishPortuguesePotawatomiPuebloPuerto RicanPuget Sound SalishRomanianRussianSalvadoranSamoanScandinavianScotch-IrishScottishSeminoleSenegaleseSerbianShoshoneSierra LeoneanSiouxSlavicSlovakSloveneSomaliSouth AfricanSouth AmericanSouth American IndianSoviet UnionSpaniardSpanishSpanish AmericanSpanish American IndianSri LankanSubsaharan AfricanSudaneseSwedishSwissSyrianTaiwaneseThaiTlingit-HaidaTohono O'OdhamTonganTrinidadian and TobagonianTsimshianTurkishU.S. Virgin IslanderUgandanUkrainianUruguayanUteVenezuelanVietnameseWelshWest IndianYakamaYaquiYugoslavianYumanYup'ikZimbabwean
Immigration
NonimmigrantsImmigrantsAfghanistanAfricaAlbaniaArgentinaArmeniaAsiaAustraliaAustriaBahamasBangladeshBarbadosBelarusBelgiumBelizeBoliviaBosnia and HerzegovinaBrazilBulgariaBurma/MyanmarCabo VerdeCambodiaCameroonCanadaCaribbeanCentral AmericaChileChinaColombiaCongoCosta RicaCroatiaCubaCzechoslovakiaDenmarkDominicaDominican RepublicEastern AfricaEastern AsiaEastern EuropeEcuadorEgyptEl SalvadorEnglandEritreaEthiopiaEuropeFijiFranceGermanyGhanaGreeceGrenadaGuatemalaGuyanaHaitiHondurasHong KongHungaryIndiaIndonesiaIranIraqIrelandIsraelItalyJamaicaJapanJordanKazakhstanKenyaKoreaKuwaitLaosLatin AmericaLatviaLiberiaLithuaniaMalaysiaMexicoMicronesiaMiddle AfricaMoldovaMoroccoNepalNetherlandsNicaraguaNigeriaNorth AmericaNorth MacedoniaNorthern AfricaNorthern EuropeNorwayOceaniaPakistanPanamaPeruPhilippinesPolandPortugalRomaniaRussiaSaudi ArabiaScotlandSenegalSerbiaSierra LeoneSingaporeSomaliaSouth AfricaSouth AmericaSouth Central AsiaSouth Eastern AsiaSouthern EuropeSpainSri LankaSt. Vincent and the GrenadinesSudanSwedenSwitzerlandSyriaTaiwanThailandTrinidad and TobagoTurkeyUgandaUkraineUruguayUzbekistanVenezuelaVietnamWest IndiesWestern AfricaWestern AsiaWestern EuropeYemenZaireZimbabweAzores
Immigrants from Lebanon
Race
Ancestry
AfghanAfricanAlaska NativeAlaskan AthabascanAlbanianAleutAlsatianAmericanApacheArabArapahoArgentineanArmenianAssyrian/Chaldean/SyriacAustralianAustrianBahamianBangladeshiBasqueBelgianBelizeanBermudanBhutaneseBlackfeetBolivianBrazilianBritishBritish West IndianBulgarianBurmeseCajunCambodianCanadianCape VerdeanCarpatho RusynCelticCentral AmericanCentral American IndianCherokeeCheyenneChickasawChileanChineseChippewaChoctawColombianColvilleComancheCosta RicanCreeCreekCroatianCrowCubanCypriotCzechCzechoslovakianDanishDelawareDominicanDutchDutch West IndianEastern EuropeanEcuadorianEgyptianEnglishEstonianEthiopianEuropeanFijianFilipinoFinnishFrenchFrench American IndianFrench CanadianGermanGerman RussianGhanaianGreekGuamanian/ChamorroGuatemalanGuyaneseHaitianHmongHonduranHopiHoumaHungarianIcelanderIndian (Asian)IndonesianInupiatIranianIraqiIrishIroquoisIsraeliItalianJamaicanJapaneseJordanianKenyanKiowaKoreanLaotianLatvianLebaneseLiberianLithuanianLumbeeLuxembourgerMacedonianMalaysianMalteseMarshalleseMenomineeMexicanMexican American IndianMongolianMoroccanNative HawaiianNavajoNepaleseNew ZealanderNicaraguanNigerianNorthern EuropeanNorwegianOkinawanOsageOttawaPaiutePakistaniPalestinianPanamanianParaguayanPennsylvania GermanPeruvianPimaPolishPortuguesePotawatomiPuebloPuerto RicanPuget Sound SalishRomanianRussianSalvadoranSamoanScandinavianScotch-IrishScottishSeminoleSenegaleseSerbianShoshoneSierra LeoneanSiouxSlavicSlovakSloveneSomaliSouth AfricanSouth AmericanSouth American IndianSoviet UnionSpaniardSpanishSpanish AmericanSpanish American IndianSri LankanSubsaharan AfricanSudaneseSwedishSwissSyrianTaiwaneseThaiTlingit-HaidaTohono O'OdhamTonganTrinidadian and TobagonianTsimshianTurkishU.S. Virgin IslanderUgandanUkrainianUruguayanUteVenezuelanVietnameseWelshWest IndianYakamaYaquiYugoslavianYumanYup'ikZimbabwean
Immigration
NonimmigrantsImmigrantsAfghanistanAfricaAlbaniaArgentinaArmeniaAsiaAustraliaAustriaBahamasBangladeshBarbadosBelarusBelgiumBelizeBoliviaBosnia and HerzegovinaBrazilBulgariaBurma/MyanmarCabo VerdeCambodiaCameroonCanadaCaribbeanCentral AmericaChileChinaColombiaCongoCosta RicaCroatiaCubaCzechoslovakiaDenmarkDominicaDominican RepublicEastern AfricaEastern AsiaEastern EuropeEcuadorEgyptEl SalvadorEnglandEritreaEthiopiaEuropeFijiFranceGermanyGhanaGreeceGrenadaGuatemalaGuyanaHaitiHondurasHong KongHungaryIndiaIndonesiaIranIraqIrelandIsraelItalyJamaicaJapanJordanKazakhstanKenyaKoreaKuwaitLaosLatin AmericaLatviaLebanonLiberiaLithuaniaMalaysiaMexicoMicronesiaMiddle AfricaMoldovaMoroccoNepalNetherlandsNicaraguaNigeriaNorth AmericaNorth MacedoniaNorthern AfricaNorthern EuropeNorwayOceaniaPakistanPanamaPeruPhilippinesPolandPortugalRomaniaRussiaSaudi ArabiaScotlandSenegalSerbiaSierra LeoneSingaporeSomaliaSouth AfricaSouth AmericaSouth Central AsiaSouth Eastern AsiaSouthern EuropeSpainSri LankaSt. Vincent and the GrenadinesSudanSwedenSwitzerlandSyriaTaiwanThailandTrinidad and TobagoTurkeyUgandaUkraineUruguayUzbekistanVenezuelaVietnamWest IndiesWestern AfricaWestern AsiaWestern EuropeYemenZaireZimbabweAzores
Family Households with Children
Income
Poverty
Unemployment
Labor Participation
Family Structure
Vehicle Availability
Education Level
Disability

Family Households with Children Comparison

Barbadians

Immigrants from Lebanon

Tragic
Exceptional
26.0%
FAMILY HOUSEHOLDS WITH CHILDREN
0.0/ 100
METRIC RATING
325th/ 347
METRIC RANK
28.6%
FAMILY HOUSEHOLDS WITH CHILDREN
99.9/ 100
METRIC RATING
63rd/ 347
METRIC RANK

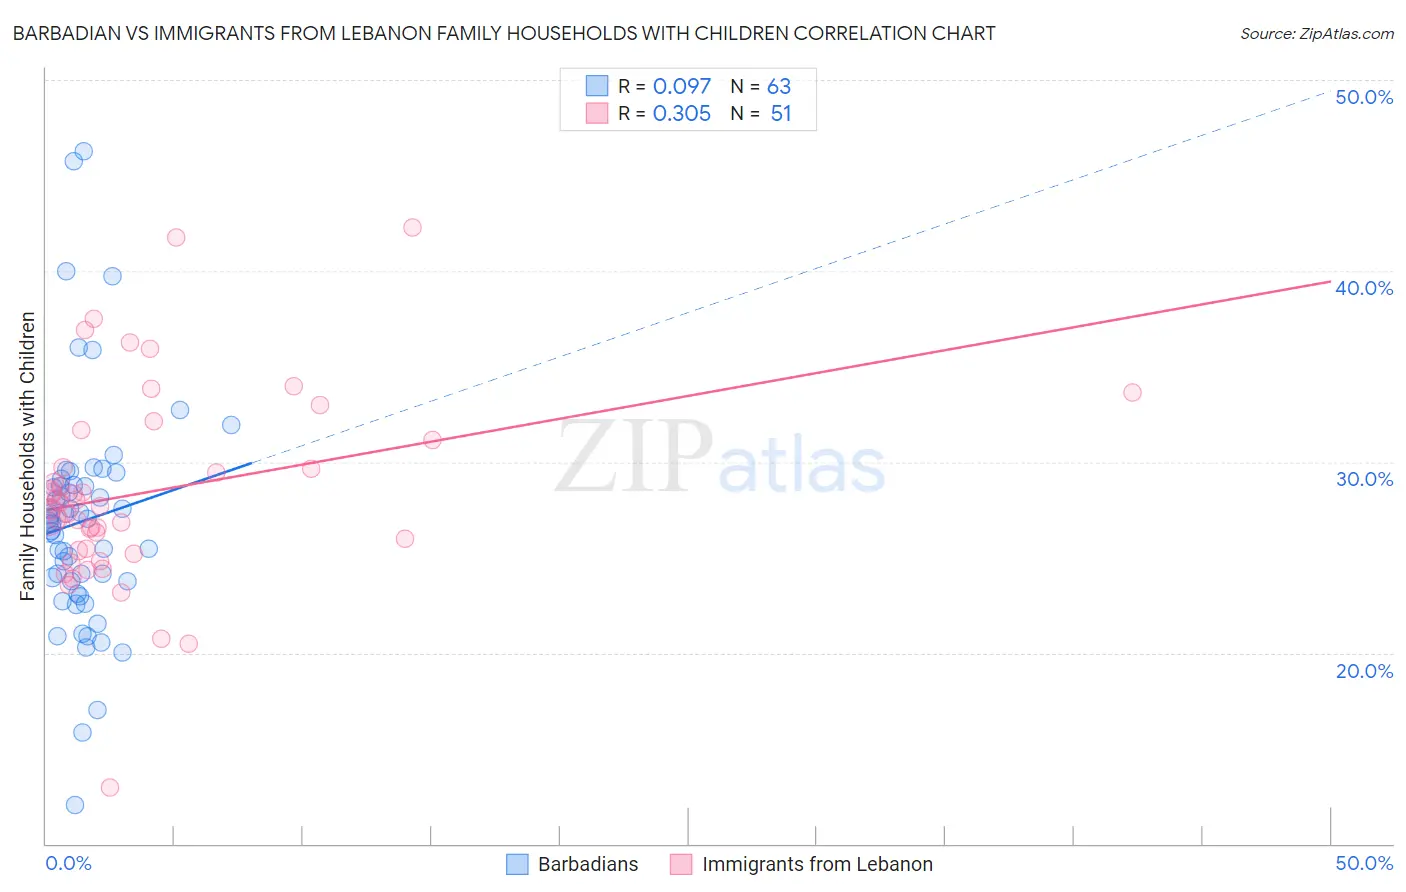
Barbadian vs Immigrants from Lebanon Family Households with Children Correlation Chart

The statistical analysis conducted on geographies consisting of 141,246,915 people shows a slight positive correlation between the proportion of Barbadians and percentage of family households with children in the United States with a correlation coefficient (R) of 0.097 and weighted average of 26.0%. Similarly, the statistical analysis conducted on geographies consisting of 217,098,842 people shows a mild positive correlation between the proportion of Immigrants from Lebanon and percentage of family households with children in the United States with a correlation coefficient (R) of 0.305 and weighted average of 28.6%, a difference of 9.9%.
Barbadian vs Immigrants from Lebanon Family Households with Children

Family Households with Children Correlation Summary

MeasurementBarbadianImmigrants from Lebanon
Minimum12.0%12.9%
Maximum46.3%42.3%
Range34.3%29.3%
Mean26.9%28.4%
Median26.8%27.7%
Interquartile 25% (IQ1)23.7%25.4%
Interquartile 75% (IQ3)28.8%31.2%
Interquartile Range (IQR)5.0%5.8%
Standard Deviation (Sample)6.0%5.2%
Standard Deviation (Population)5.9%5.2%

Similar Demographics by Family Households with Children

Demographics Similar to Barbadians by Family Households with Children

In terms of family households with children, the demographic groups most similar to Barbadians are Immigrants from Ireland (26.0%, a difference of 0.030%), Chinese (26.0%, a difference of 0.060%), Immigrants from Australia (26.0%, a difference of 0.090%), Immigrants from Greece (26.0%, a difference of 0.12%), and British West Indian (26.0%, a difference of 0.13%).
DemographicsRating | RankFamily Households with Children
Iroquois
0.0
/100
|
#318
Tragic
26.1%
Immigrants | France
0.0
/100
|
#319
Tragic
26.0%
Tlingit-Haida
0.0
/100
|
#320
Tragic
26.0%
British West Indians
0.0
/100
|
#321
Tragic
26.0%
Immigrants | Greece
0.0
/100
|
#322
Tragic
26.0%
Immigrants | Australia
0.0
/100
|
#323
Tragic
26.0%
Chinese
0.0
/100
|
#324
Tragic
26.0%
Barbadians
0.0
/100
|
#325
Tragic
26.0%
Immigrants | Ireland
0.0
/100
|
#326
Tragic
26.0%
Immigrants | Barbados
0.0
/100
|
#327
Tragic
26.0%
Immigrants | Albania
0.0
/100
|
#328
Tragic
25.9%
Cypriots
0.0
/100
|
#329
Tragic
25.9%
Immigrants | Latvia
0.0
/100
|
#330
Tragic
25.9%
Slovenes
0.0
/100
|
#331
Tragic
25.8%
Immigrants | Austria
0.0
/100
|
#332
Tragic
25.8%

Demographics Similar to Immigrants from Lebanon by Family Households with Children

In terms of family households with children, the demographic groups most similar to Immigrants from Lebanon are Immigrants from Ghana (28.6%, a difference of 0.010%), Egyptian (28.6%, a difference of 0.010%), Filipino (28.6%, a difference of 0.070%), Hmong (28.6%, a difference of 0.090%), and Immigrants from Nigeria (28.6%, a difference of 0.14%).
DemographicsRating | RankFamily Households with Children
Immigrants | Guatemala
100.0
/100
|
#56
Exceptional
28.8%
Danes
100.0
/100
|
#57
Exceptional
28.7%
Hawaiians
100.0
/100
|
#58
Exceptional
28.7%
Immigrants | Nigeria
100.0
/100
|
#59
Exceptional
28.6%
Hmong
99.9
/100
|
#60
Exceptional
28.6%
Immigrants | Ghana
99.9
/100
|
#61
Exceptional
28.6%
Egyptians
99.9
/100
|
#62
Exceptional
28.6%
Immigrants | Lebanon
99.9
/100
|
#63
Exceptional
28.6%
Filipinos
99.9
/100
|
#64
Exceptional
28.6%
Hondurans
99.9
/100
|
#65
Exceptional
28.5%
Immigrants | Egypt
99.9
/100
|
#66
Exceptional
28.5%
Ghanaians
99.9
/100
|
#67
Exceptional
28.5%
Houma
99.9
/100
|
#68
Exceptional
28.5%
Immigrants | Korea
99.9
/100
|
#69
Exceptional
28.5%
Immigrants | Honduras
99.9
/100
|
#70
Exceptional
28.5%