Arapaho vs Navajo Single Father Households
COMPARE
Arapaho
Navajo
Single Father Households
Single Father Households Comparison
Arapaho
Navajo
2.9%
SINGLE FATHER HOUSEHOLDS
0.0/ 100
METRIC RATING
313th/ 347
METRIC RANK
3.2%
SINGLE FATHER HOUSEHOLDS
0.0/ 100
METRIC RATING
331st/ 347
METRIC RANK
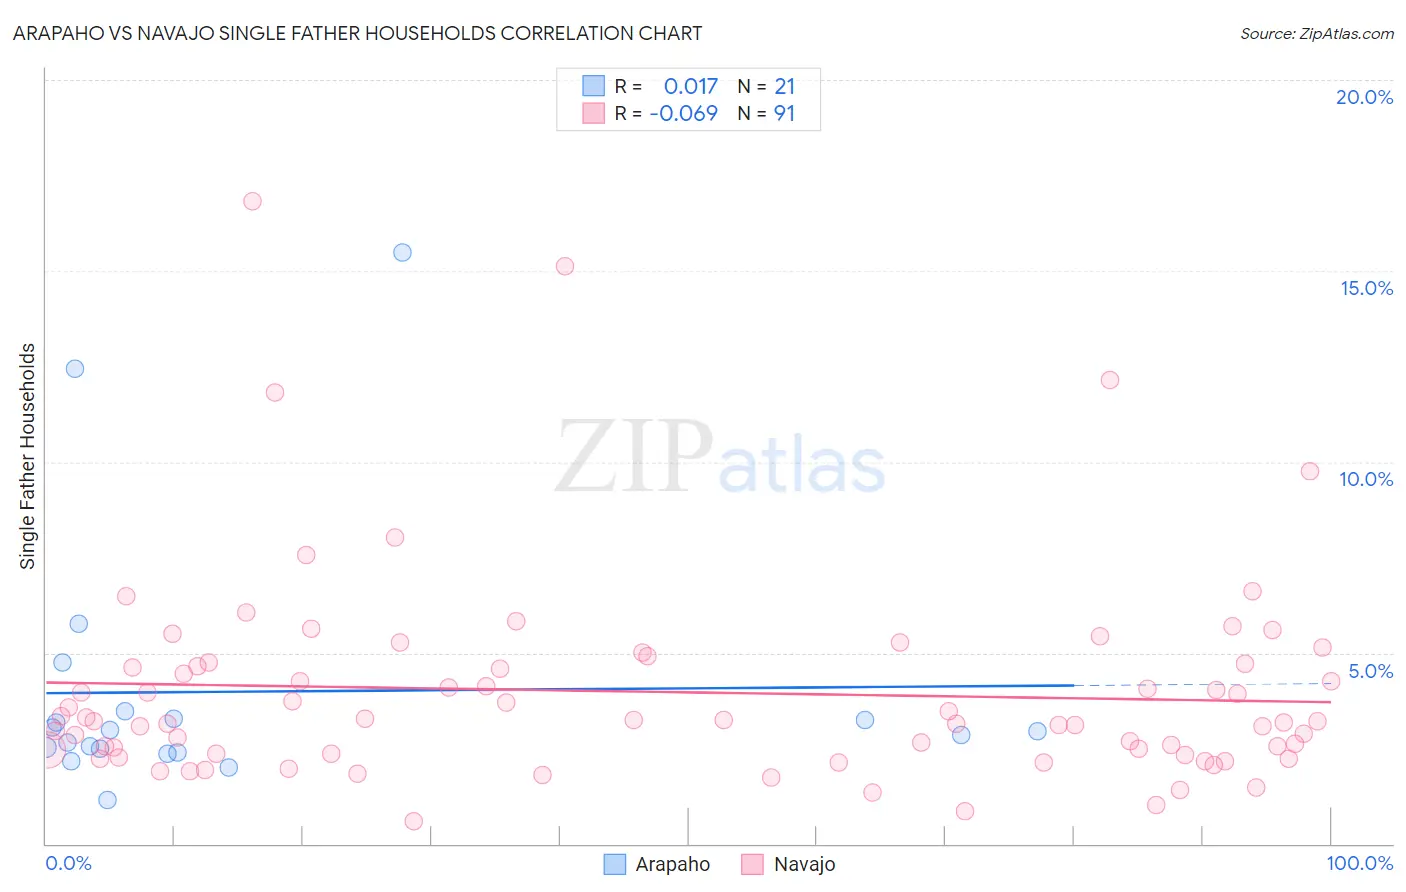
Arapaho vs Navajo Single Father Households Correlation Chart
The statistical analysis conducted on geographies consisting of 29,720,466 people shows no correlation between the proportion of Arapaho and percentage of single father households in the United States with a correlation coefficient (R) of 0.017 and weighted average of 2.9%. Similarly, the statistical analysis conducted on geographies consisting of 223,786,541 people shows a slight negative correlation between the proportion of Navajo and percentage of single father households in the United States with a correlation coefficient (R) of -0.069 and weighted average of 3.2%, a difference of 9.9%.
Single Father Households Correlation Summary
| Measurement | Arapaho | Navajo |
| Minimum | 1.1% | 0.57% |
| Maximum | 15.5% | 16.8% |
| Range | 14.4% | 16.2% |
| Mean | 4.0% | 4.0% |
| Median | 3.0% | 3.2% |
| Interquartile 25% (IQ1) | 2.4% | 2.4% |
| Interquartile 75% (IQ3) | 3.4% | 4.7% |
| Interquartile Range (IQR) | 0.93% | 2.4% |
| Standard Deviation (Sample) | 3.5% | 2.7% |
| Standard Deviation (Population) | 3.4% | 2.7% |
Demographics Similar to Arapaho and Navajo by Single Father Households
In terms of single father households, the demographic groups most similar to Arapaho are Salvadoran (2.9%, a difference of 0.25%), Tsimshian (2.9%, a difference of 0.42%), Cheyenne (2.9%, a difference of 0.64%), Houma (2.9%, a difference of 0.64%), and Immigrants from El Salvador (2.9%, a difference of 1.5%). Similarly, the demographic groups most similar to Navajo are Yaqui (3.2%, a difference of 0.040%), Nepalese (3.1%, a difference of 2.3%), Chippewa (3.1%, a difference of 3.2%), Immigrants from Cabo Verde (3.1%, a difference of 3.3%), and Bangladeshi (3.1%, a difference of 3.8%).
| Demographics | Rating | Rank | Single Father Households |
| Tsimshian | 0.0 /100 | #312 | Tragic 2.9% |
| Arapaho | 0.0 /100 | #313 | Tragic 2.9% |
| Salvadorans | 0.0 /100 | #314 | Tragic 2.9% |
| Cheyenne | 0.0 /100 | #315 | Tragic 2.9% |
| Houma | 0.0 /100 | #316 | Tragic 2.9% |
| Immigrants | El Salvador | 0.0 /100 | #317 | Tragic 2.9% |
| Cape Verdeans | 0.0 /100 | #318 | Tragic 2.9% |
| Ute | 0.0 /100 | #319 | Tragic 3.0% |
| Guatemalans | 0.0 /100 | #320 | Tragic 3.0% |
| Mexicans | 0.0 /100 | #321 | Tragic 3.0% |
| Immigrants | Guatemala | 0.0 /100 | #322 | Tragic 3.0% |
| Immigrants | Central America | 0.0 /100 | #323 | Tragic 3.0% |
| Fijians | 0.0 /100 | #324 | Tragic 3.0% |
| Immigrants | Mexico | 0.0 /100 | #325 | Tragic 3.0% |
| Aleuts | 0.0 /100 | #326 | Tragic 3.0% |
| Bangladeshis | 0.0 /100 | #327 | Tragic 3.1% |
| Immigrants | Cabo Verde | 0.0 /100 | #328 | Tragic 3.1% |
| Chippewa | 0.0 /100 | #329 | Tragic 3.1% |
| Nepalese | 0.0 /100 | #330 | Tragic 3.1% |
| Navajo | 0.0 /100 | #331 | Tragic 3.2% |
| Yaqui | 0.0 /100 | #332 | Tragic 3.2% |