Aleut vs Jamaican Births to Unmarried Women
COMPARE
Aleut
Jamaican
Births to Unmarried Women
Births to Unmarried Women Comparison
Aleuts
Jamaicans
39.3%
BIRTHS TO UNMARRIED WOMEN
0.0/ 100
METRIC RATING
308th/ 347
METRIC RANK
38.5%
BIRTHS TO UNMARRIED WOMEN
0.0/ 100
METRIC RATING
298th/ 347
METRIC RANK
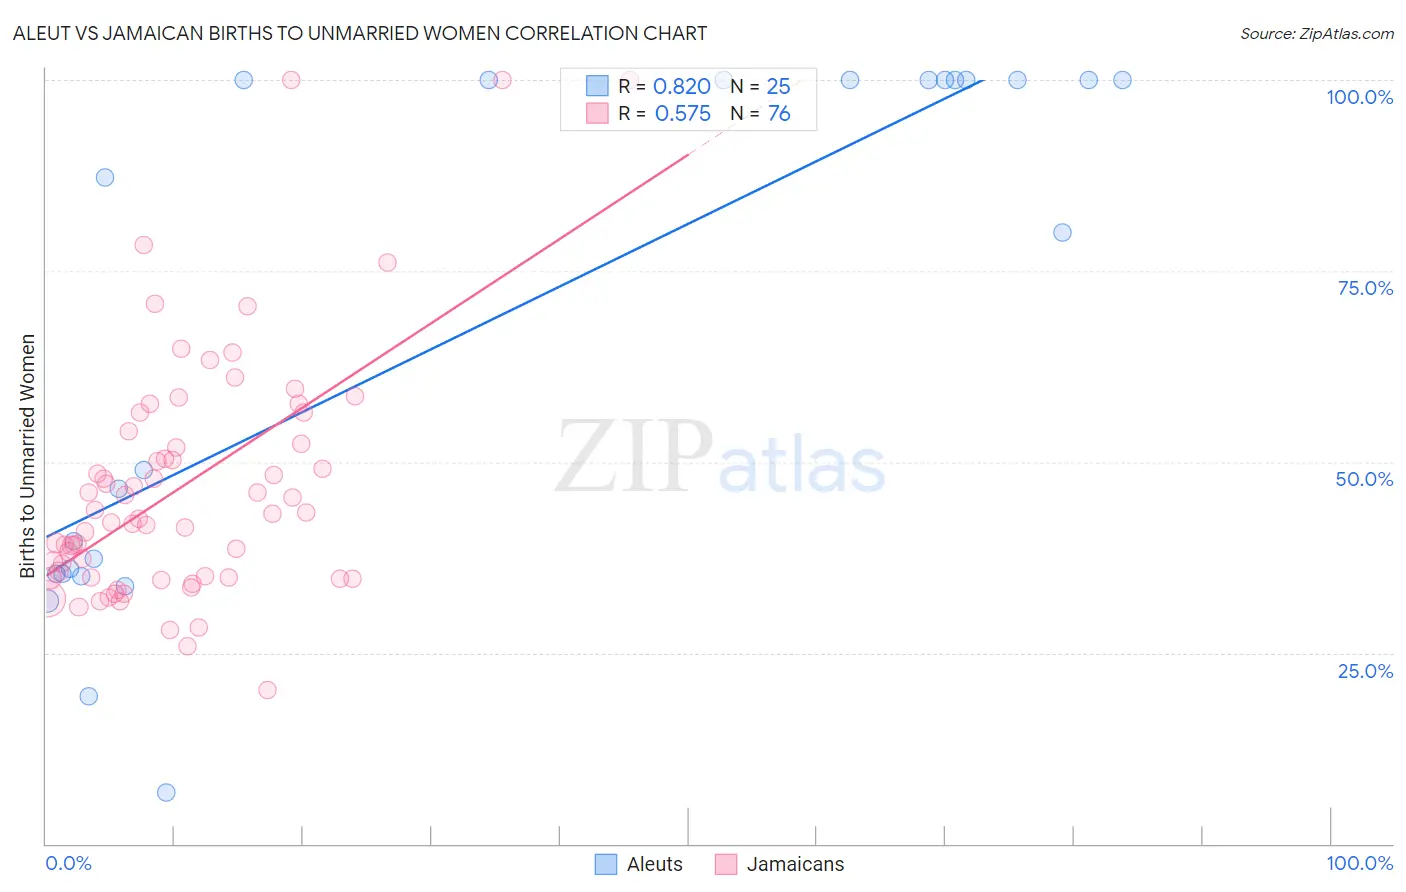
Aleut vs Jamaican Births to Unmarried Women Correlation Chart
The statistical analysis conducted on geographies consisting of 60,596,367 people shows a very strong positive correlation between the proportion of Aleuts and percentage of births to unmarried women in the United States with a correlation coefficient (R) of 0.820 and weighted average of 39.3%. Similarly, the statistical analysis conducted on geographies consisting of 347,671,371 people shows a substantial positive correlation between the proportion of Jamaicans and percentage of births to unmarried women in the United States with a correlation coefficient (R) of 0.575 and weighted average of 38.5%, a difference of 2.2%.
Births to Unmarried Women Correlation Summary
| Measurement | Aleut | Jamaican |
| Minimum | 6.7% | 20.2% |
| Maximum | 100.0% | 100.0% |
| Range | 93.3% | 79.8% |
| Mean | 66.9% | 46.7% |
| Median | 80.0% | 42.9% |
| Interquartile 25% (IQ1) | 35.3% | 34.9% |
| Interquartile 75% (IQ3) | 100.0% | 53.2% |
| Interquartile Range (IQR) | 64.7% | 18.3% |
| Standard Deviation (Sample) | 33.7% | 16.1% |
| Standard Deviation (Population) | 33.0% | 16.0% |
Demographics Similar to Aleuts and Jamaicans by Births to Unmarried Women
In terms of births to unmarried women, the demographic groups most similar to Aleuts are Immigrants from Honduras (39.3%, a difference of 0.090%), Cuban (39.4%, a difference of 0.12%), Immigrants from Dominica (39.5%, a difference of 0.34%), Immigrants from the Azores (39.6%, a difference of 0.58%), and U.S. Virgin Islander (39.6%, a difference of 0.60%). Similarly, the demographic groups most similar to Jamaicans are Dutch West Indian (38.4%, a difference of 0.20%), Spanish American (38.6%, a difference of 0.20%), Immigrants from West Indies (38.6%, a difference of 0.26%), Haitian (38.6%, a difference of 0.27%), and Alaska Native (38.3%, a difference of 0.48%).
| Demographics | Rating | Rank | Births to Unmarried Women |
| Immigrants | Nicaragua | 0.0 /100 | #293 | Tragic 38.0% |
| British West Indians | 0.0 /100 | #294 | Tragic 38.0% |
| Iroquois | 0.0 /100 | #295 | Tragic 38.2% |
| Alaska Natives | 0.0 /100 | #296 | Tragic 38.3% |
| Dutch West Indians | 0.0 /100 | #297 | Tragic 38.4% |
| Jamaicans | 0.0 /100 | #298 | Tragic 38.5% |
| Spanish Americans | 0.0 /100 | #299 | Tragic 38.6% |
| Immigrants | West Indies | 0.0 /100 | #300 | Tragic 38.6% |
| Haitians | 0.0 /100 | #301 | Tragic 38.6% |
| Hondurans | 0.0 /100 | #302 | Tragic 38.7% |
| Immigrants | Jamaica | 0.0 /100 | #303 | Tragic 38.8% |
| Yaqui | 0.0 /100 | #304 | Tragic 38.8% |
| Immigrants | Haiti | 0.0 /100 | #305 | Tragic 38.9% |
| Central American Indians | 0.0 /100 | #306 | Tragic 39.0% |
| Immigrants | Honduras | 0.0 /100 | #307 | Tragic 39.3% |
| Aleuts | 0.0 /100 | #308 | Tragic 39.3% |
| Cubans | 0.0 /100 | #309 | Tragic 39.4% |
| Immigrants | Dominica | 0.0 /100 | #310 | Tragic 39.5% |
| Immigrants | Azores | 0.0 /100 | #311 | Tragic 39.6% |
| U.S. Virgin Islanders | 0.0 /100 | #312 | Tragic 39.6% |
| Africans | 0.0 /100 | #313 | Tragic 39.7% |