Aleut vs Chilean Currently Married
COMPARE
Aleut
Chilean
Currently Married
Currently Married Comparison
Aleuts
Chileans
46.7%
CURRENTLY MARRIED
52.0/ 100
METRIC RATING
172nd/ 347
METRIC RANK
47.0%
CURRENTLY MARRIED
69.8/ 100
METRIC RATING
151st/ 347
METRIC RANK
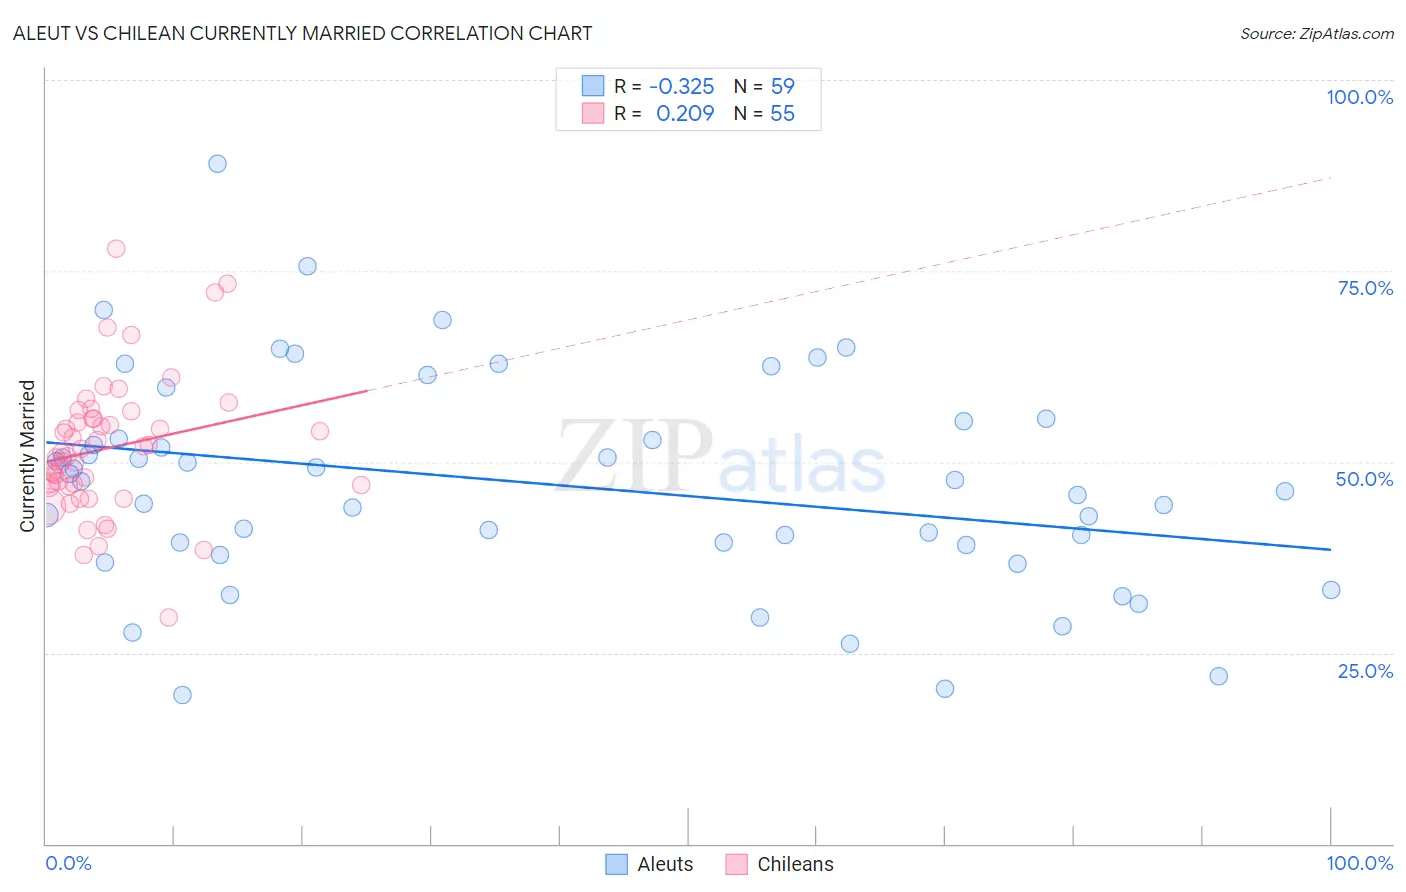
Aleut vs Chilean Currently Married Correlation Chart
The statistical analysis conducted on geographies consisting of 61,778,471 people shows a mild negative correlation between the proportion of Aleuts and percentage of population currently married in the United States with a correlation coefficient (R) of -0.325 and weighted average of 46.7%. Similarly, the statistical analysis conducted on geographies consisting of 256,662,716 people shows a weak positive correlation between the proportion of Chileans and percentage of population currently married in the United States with a correlation coefficient (R) of 0.209 and weighted average of 47.0%, a difference of 0.69%.
Currently Married Correlation Summary
| Measurement | Aleut | Chilean |
| Minimum | 19.5% | 29.6% |
| Maximum | 89.1% | 78.0% |
| Range | 69.6% | 48.4% |
| Mean | 47.2% | 51.8% |
| Median | 47.4% | 51.2% |
| Interquartile 25% (IQ1) | 39.1% | 46.9% |
| Interquartile 75% (IQ3) | 55.3% | 55.6% |
| Interquartile Range (IQR) | 16.2% | 8.7% |
| Standard Deviation (Sample) | 14.0% | 8.9% |
| Standard Deviation (Population) | 13.9% | 8.8% |
Similar Demographics by Currently Married
Demographics Similar to Aleuts by Currently Married
In terms of currently married, the demographic groups most similar to Aleuts are Immigrants from Zimbabwe (46.7%, a difference of 0.010%), Tlingit-Haida (46.7%, a difference of 0.030%), Peruvian (46.6%, a difference of 0.070%), Immigrants from Brazil (46.6%, a difference of 0.080%), and Hawaiian (46.6%, a difference of 0.13%).
| Demographics | Rating | Rank | Currently Married |
| Samoans | 59.8 /100 | #165 | Average 46.8% |
| Immigrants | Syria | 59.3 /100 | #166 | Average 46.8% |
| Spaniards | 58.8 /100 | #167 | Average 46.8% |
| Immigrants | Afghanistan | 58.2 /100 | #168 | Average 46.8% |
| Armenians | 58.2 /100 | #169 | Average 46.8% |
| Immigrants | Latvia | 56.7 /100 | #170 | Average 46.7% |
| Immigrants | Zimbabwe | 52.4 /100 | #171 | Average 46.7% |
| Aleuts | 52.0 /100 | #172 | Average 46.7% |
| Tlingit-Haida | 51.2 /100 | #173 | Average 46.7% |
| Peruvians | 50.0 /100 | #174 | Average 46.6% |
| Immigrants | Brazil | 49.9 /100 | #175 | Average 46.6% |
| Hawaiians | 48.6 /100 | #176 | Average 46.6% |
| Israelis | 48.6 /100 | #177 | Average 46.6% |
| Chickasaw | 47.8 /100 | #178 | Average 46.6% |
| Immigrants | Oceania | 44.6 /100 | #179 | Average 46.5% |
Demographics Similar to Chileans by Currently Married
In terms of currently married, the demographic groups most similar to Chileans are Zimbabwean (47.0%, a difference of 0.010%), Immigrants from Turkey (47.0%, a difference of 0.010%), Cambodian (47.0%, a difference of 0.030%), Immigrants from Serbia (47.0%, a difference of 0.040%), and Immigrants from Venezuela (47.0%, a difference of 0.050%).
| Demographics | Rating | Rank | Currently Married |
| Hmong | 73.4 /100 | #144 | Good 47.1% |
| Immigrants | South Eastern Asia | 72.9 /100 | #145 | Good 47.1% |
| Carpatho Rusyns | 72.6 /100 | #146 | Good 47.0% |
| Immigrants | Argentina | 72.0 /100 | #147 | Good 47.0% |
| Cambodians | 70.4 /100 | #148 | Good 47.0% |
| Zimbabweans | 70.1 /100 | #149 | Good 47.0% |
| Immigrants | Turkey | 70.0 /100 | #150 | Good 47.0% |
| Chileans | 69.8 /100 | #151 | Good 47.0% |
| Immigrants | Serbia | 68.8 /100 | #152 | Good 47.0% |
| Immigrants | Venezuela | 68.6 /100 | #153 | Good 47.0% |
| Albanians | 68.6 /100 | #154 | Good 47.0% |
| Arabs | 68.6 /100 | #155 | Good 47.0% |
| Spanish | 68.1 /100 | #156 | Good 47.0% |
| Immigrants | Switzerland | 67.8 /100 | #157 | Good 46.9% |
| Cherokee | 66.8 /100 | #158 | Good 46.9% |