Alaska Native vs French Canadian Single Mother Households
COMPARE
Alaska Native
French Canadian
Single Mother Households
Single Mother Households Comparison
Alaska Natives
French Canadians
7.4%
SINGLE MOTHER HOUSEHOLDS
0.2/ 100
METRIC RATING
257th/ 347
METRIC RANK
6.0%
SINGLE MOTHER HOUSEHOLDS
82.6/ 100
METRIC RATING
146th/ 347
METRIC RANK
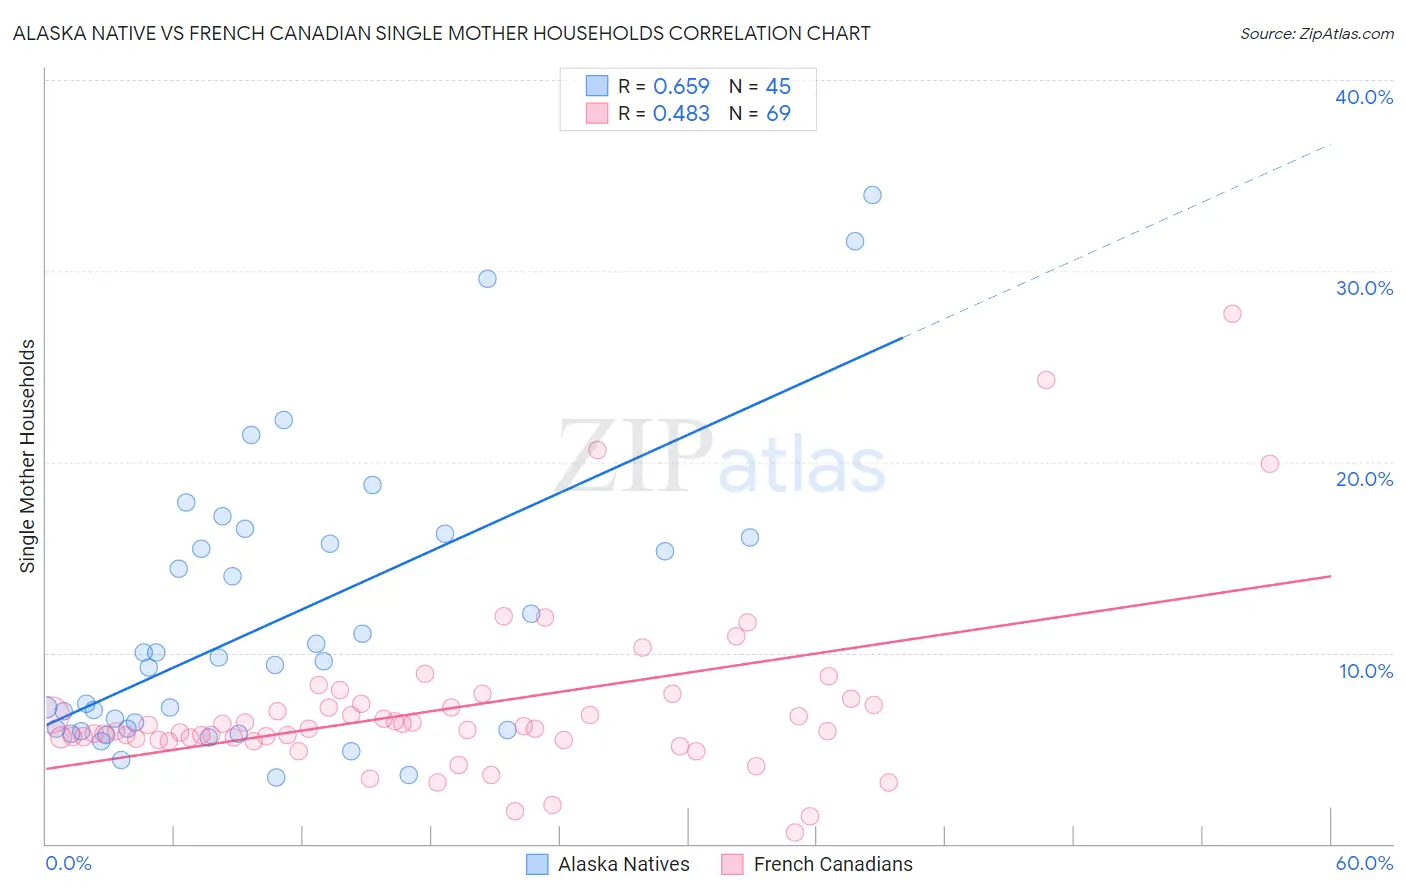
Alaska Native vs French Canadian Single Mother Households Correlation Chart
The statistical analysis conducted on geographies consisting of 76,685,666 people shows a significant positive correlation between the proportion of Alaska Natives and percentage of single mother households in the United States with a correlation coefficient (R) of 0.659 and weighted average of 7.4%. Similarly, the statistical analysis conducted on geographies consisting of 499,765,796 people shows a moderate positive correlation between the proportion of French Canadians and percentage of single mother households in the United States with a correlation coefficient (R) of 0.483 and weighted average of 6.0%, a difference of 22.4%.
Single Mother Households Correlation Summary
| Measurement | Alaska Native | French Canadian |
| Minimum | 3.4% | 0.62% |
| Maximum | 34.0% | 27.8% |
| Range | 30.6% | 27.1% |
| Mean | 11.7% | 7.1% |
| Median | 9.6% | 6.0% |
| Interquartile 25% (IQ1) | 6.0% | 5.5% |
| Interquartile 75% (IQ3) | 15.9% | 7.3% |
| Interquartile Range (IQR) | 9.9% | 1.8% |
| Standard Deviation (Sample) | 7.4% | 4.6% |
| Standard Deviation (Population) | 7.3% | 4.6% |
Similar Demographics by Single Mother Households
Demographics Similar to Alaska Natives by Single Mother Households
In terms of single mother households, the demographic groups most similar to Alaska Natives are Pueblo (7.4%, a difference of 0.020%), Seminole (7.4%, a difference of 0.040%), Immigrants from Yemen (7.4%, a difference of 0.040%), Immigrants from Zaire (7.4%, a difference of 0.080%), and Japanese (7.4%, a difference of 0.10%).
| Demographics | Rating | Rank | Single Mother Households |
| Immigrants | Africa | 0.4 /100 | #250 | Tragic 7.3% |
| Malaysians | 0.3 /100 | #251 | Tragic 7.3% |
| Alaskan Athabascans | 0.3 /100 | #252 | Tragic 7.3% |
| Cajuns | 0.3 /100 | #253 | Tragic 7.3% |
| Immigrants | Ecuador | 0.3 /100 | #254 | Tragic 7.3% |
| Mexican American Indians | 0.2 /100 | #255 | Tragic 7.4% |
| Seminole | 0.2 /100 | #256 | Tragic 7.4% |
| Alaska Natives | 0.2 /100 | #257 | Tragic 7.4% |
| Pueblo | 0.2 /100 | #258 | Tragic 7.4% |
| Immigrants | Yemen | 0.2 /100 | #259 | Tragic 7.4% |
| Immigrants | Zaire | 0.2 /100 | #260 | Tragic 7.4% |
| Japanese | 0.2 /100 | #261 | Tragic 7.4% |
| Immigrants | Somalia | 0.2 /100 | #262 | Tragic 7.4% |
| Immigrants | Nicaragua | 0.2 /100 | #263 | Tragic 7.4% |
| Yaqui | 0.1 /100 | #264 | Tragic 7.4% |
Demographics Similar to French Canadians by Single Mother Households
In terms of single mother households, the demographic groups most similar to French Canadians are Immigrants from Jordan (6.0%, a difference of 0.060%), Scotch-Irish (6.0%, a difference of 0.11%), Immigrants from Albania (6.1%, a difference of 0.21%), Arab (6.0%, a difference of 0.29%), and Zimbabwean (6.1%, a difference of 0.35%).
| Demographics | Rating | Rank | Single Mother Households |
| Syrians | 86.0 /100 | #139 | Excellent 6.0% |
| French | 85.7 /100 | #140 | Excellent 6.0% |
| Tsimshian | 85.2 /100 | #141 | Excellent 6.0% |
| Immigrants | Egypt | 85.0 /100 | #142 | Excellent 6.0% |
| Immigrants | Iraq | 84.8 /100 | #143 | Excellent 6.0% |
| Koreans | 84.4 /100 | #144 | Excellent 6.0% |
| Arabs | 84.0 /100 | #145 | Excellent 6.0% |
| French Canadians | 82.6 /100 | #146 | Excellent 6.0% |
| Immigrants | Jordan | 82.3 /100 | #147 | Excellent 6.0% |
| Scotch-Irish | 82.0 /100 | #148 | Excellent 6.0% |
| Immigrants | Albania | 81.5 /100 | #149 | Excellent 6.1% |
| Zimbabweans | 80.7 /100 | #150 | Excellent 6.1% |
| Immigrants | Southern Europe | 80.5 /100 | #151 | Excellent 6.1% |
| Pakistanis | 79.2 /100 | #152 | Good 6.1% |
| Immigrants | Brazil | 78.9 /100 | #153 | Good 6.1% |