Zimbabwean vs Native Hawaiian Bachelor's Degree
COMPARE
Zimbabwean
Native Hawaiian
Bachelor's Degree
Bachelor's Degree Comparison
Zimbabweans
Native Hawaiians
43.3%
BACHELOR'S DEGREE
99.7/ 100
METRIC RATING
65th/ 347
METRIC RANK
33.2%
BACHELOR'S DEGREE
0.7/ 100
METRIC RATING
254th/ 347
METRIC RANK
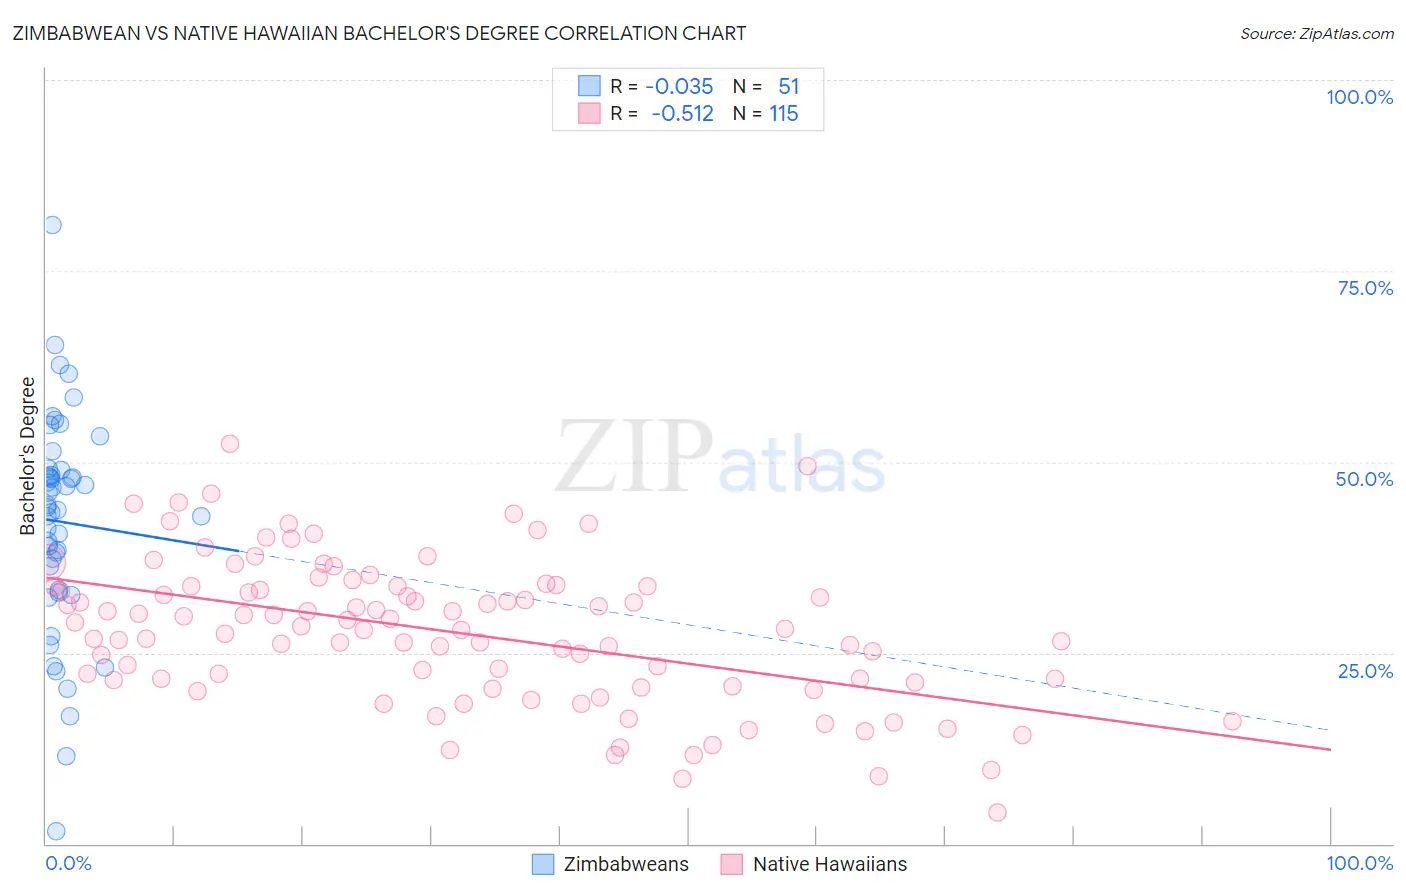
Zimbabwean vs Native Hawaiian Bachelor's Degree Correlation Chart
The statistical analysis conducted on geographies consisting of 69,203,243 people shows no correlation between the proportion of Zimbabweans and percentage of population with at least bachelor's degree education in the United States with a correlation coefficient (R) of -0.035 and weighted average of 43.3%. Similarly, the statistical analysis conducted on geographies consisting of 332,091,621 people shows a substantial negative correlation between the proportion of Native Hawaiians and percentage of population with at least bachelor's degree education in the United States with a correlation coefficient (R) of -0.512 and weighted average of 33.2%, a difference of 30.3%.
Bachelor's Degree Correlation Summary
| Measurement | Zimbabwean | Native Hawaiian |
| Minimum | 1.7% | 4.0% |
| Maximum | 81.0% | 52.3% |
| Range | 79.3% | 48.3% |
| Mean | 42.1% | 27.7% |
| Median | 44.0% | 28.2% |
| Interquartile 25% (IQ1) | 33.2% | 21.1% |
| Interquartile 75% (IQ3) | 49.0% | 33.6% |
| Interquartile Range (IQR) | 15.8% | 12.5% |
| Standard Deviation (Sample) | 14.3% | 9.4% |
| Standard Deviation (Population) | 14.1% | 9.4% |
Similar Demographics by Bachelor's Degree
Demographics Similar to Zimbabweans by Bachelor's Degree
In terms of bachelor's degree, the demographic groups most similar to Zimbabweans are Argentinean (43.3%, a difference of 0.0%), Immigrants from Netherlands (43.3%, a difference of 0.020%), Egyptian (43.3%, a difference of 0.040%), Immigrants from Indonesia (43.3%, a difference of 0.060%), and Immigrants from Europe (43.4%, a difference of 0.28%).
| Demographics | Rating | Rank | Bachelor's Degree |
| Immigrants | Czechoslovakia | 99.9 /100 | #58 | Exceptional 44.0% |
| Australians | 99.9 /100 | #59 | Exceptional 44.0% |
| New Zealanders | 99.9 /100 | #60 | Exceptional 44.0% |
| South Africans | 99.8 /100 | #61 | Exceptional 43.6% |
| Immigrants | Kazakhstan | 99.8 /100 | #62 | Exceptional 43.4% |
| Immigrants | Europe | 99.8 /100 | #63 | Exceptional 43.4% |
| Argentineans | 99.7 /100 | #64 | Exceptional 43.3% |
| Zimbabweans | 99.7 /100 | #65 | Exceptional 43.3% |
| Immigrants | Netherlands | 99.7 /100 | #66 | Exceptional 43.3% |
| Egyptians | 99.7 /100 | #67 | Exceptional 43.3% |
| Immigrants | Indonesia | 99.7 /100 | #68 | Exceptional 43.3% |
| Immigrants | Pakistan | 99.7 /100 | #69 | Exceptional 43.1% |
| Immigrants | Romania | 99.6 /100 | #70 | Exceptional 42.9% |
| Immigrants | Argentina | 99.6 /100 | #71 | Exceptional 42.8% |
| Ethiopians | 99.5 /100 | #72 | Exceptional 42.8% |
Demographics Similar to Native Hawaiians by Bachelor's Degree
In terms of bachelor's degree, the demographic groups most similar to Native Hawaiians are Iroquois (33.2%, a difference of 0.020%), U.S. Virgin Islander (33.2%, a difference of 0.060%), Nicaraguan (33.1%, a difference of 0.20%), Immigrants from Bahamas (33.3%, a difference of 0.27%), and Japanese (33.3%, a difference of 0.34%).
| Demographics | Rating | Rank | Bachelor's Degree |
| Immigrants | Congo | 1.0 /100 | #247 | Tragic 33.6% |
| Cree | 1.0 /100 | #248 | Tragic 33.6% |
| Immigrants | Liberia | 0.9 /100 | #249 | Tragic 33.5% |
| Indonesians | 0.9 /100 | #250 | Tragic 33.5% |
| Japanese | 0.7 /100 | #251 | Tragic 33.3% |
| Immigrants | Bahamas | 0.7 /100 | #252 | Tragic 33.3% |
| U.S. Virgin Islanders | 0.7 /100 | #253 | Tragic 33.2% |
| Native Hawaiians | 0.7 /100 | #254 | Tragic 33.2% |
| Iroquois | 0.7 /100 | #255 | Tragic 33.2% |
| Nicaraguans | 0.6 /100 | #256 | Tragic 33.1% |
| Spanish Americans | 0.6 /100 | #257 | Tragic 33.1% |
| French American Indians | 0.6 /100 | #258 | Tragic 33.1% |
| Osage | 0.5 /100 | #259 | Tragic 33.0% |
| Malaysians | 0.5 /100 | #260 | Tragic 32.9% |
| Africans | 0.5 /100 | #261 | Tragic 32.9% |