Zimbabwean vs Cherokee Doctorate Degree
COMPARE
Zimbabwean
Cherokee
Doctorate Degree
Doctorate Degree Comparison
Zimbabweans
Cherokee
2.3%
DOCTORATE DEGREE
99.8/ 100
METRIC RATING
67th/ 347
METRIC RANK
1.5%
DOCTORATE DEGREE
0.3/ 100
METRIC RATING
286th/ 347
METRIC RANK
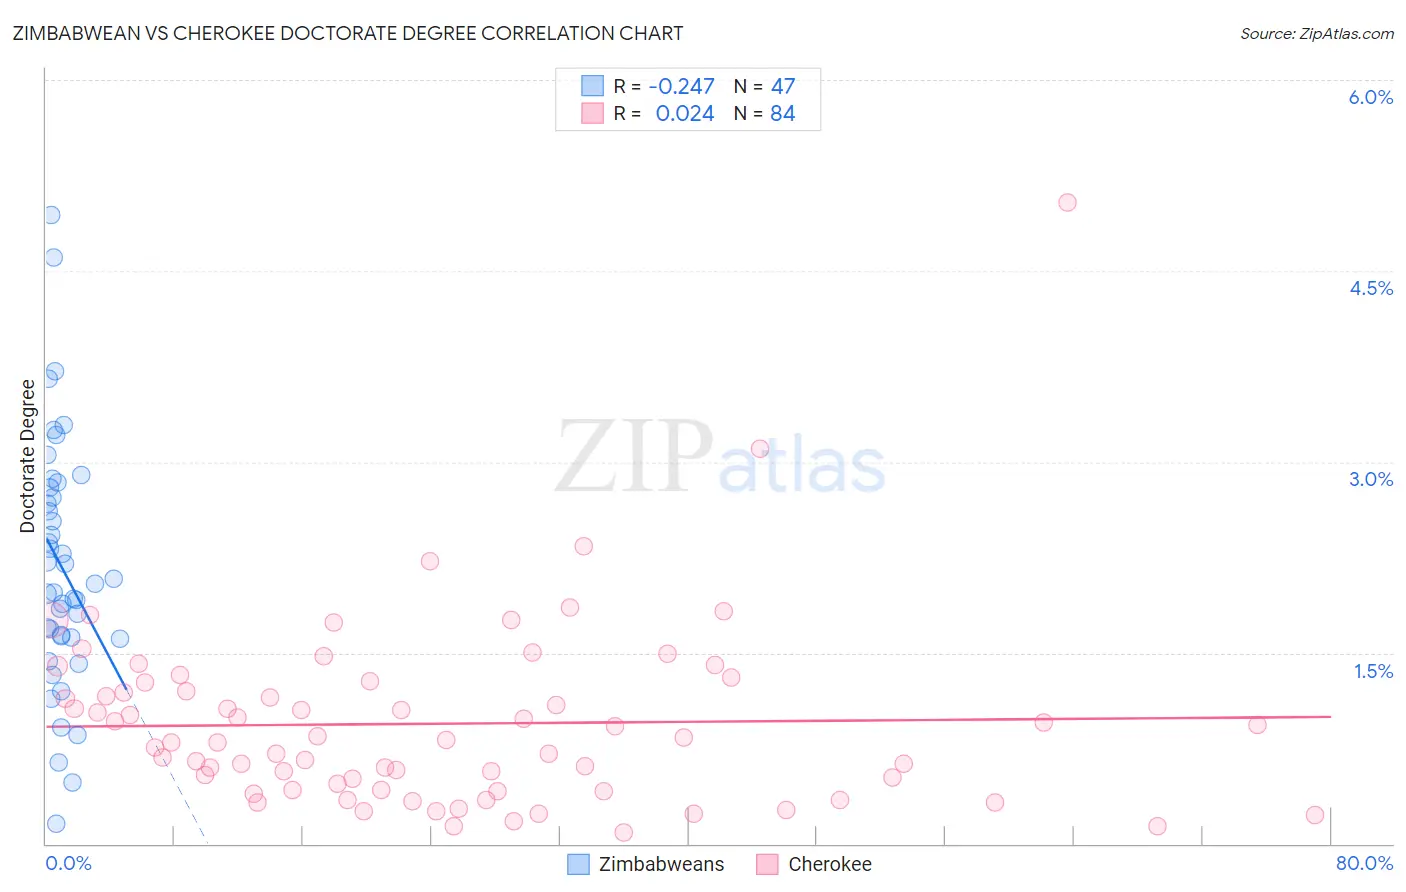
Zimbabwean vs Cherokee Doctorate Degree Correlation Chart
The statistical analysis conducted on geographies consisting of 69,036,010 people shows a weak negative correlation between the proportion of Zimbabweans and percentage of population with at least doctorate degree education in the United States with a correlation coefficient (R) of -0.247 and weighted average of 2.3%. Similarly, the statistical analysis conducted on geographies consisting of 478,818,263 people shows no correlation between the proportion of Cherokee and percentage of population with at least doctorate degree education in the United States with a correlation coefficient (R) of 0.024 and weighted average of 1.5%, a difference of 56.4%.
Doctorate Degree Correlation Summary
| Measurement | Zimbabwean | Cherokee |
| Minimum | 0.16% | 0.091% |
| Maximum | 4.9% | 5.0% |
| Range | 4.8% | 5.0% |
| Mean | 2.2% | 0.94% |
| Median | 2.0% | 0.81% |
| Interquartile 25% (IQ1) | 1.6% | 0.43% |
| Interquartile 75% (IQ3) | 2.8% | 1.2% |
| Interquartile Range (IQR) | 1.2% | 0.81% |
| Standard Deviation (Sample) | 0.98% | 0.73% |
| Standard Deviation (Population) | 0.97% | 0.72% |
Similar Demographics by Doctorate Degree
Demographics Similar to Zimbabweans by Doctorate Degree
In terms of doctorate degree, the demographic groups most similar to Zimbabweans are Immigrants from Kazakhstan (2.3%, a difference of 0.23%), Argentinean (2.3%, a difference of 0.46%), Carpatho Rusyn (2.3%, a difference of 0.48%), Lithuanian (2.3%, a difference of 0.62%), and Immigrants from Bolivia (2.3%, a difference of 0.62%).
| Demographics | Rating | Rank | Doctorate Degree |
| Immigrants | Serbia | 99.9 /100 | #60 | Exceptional 2.3% |
| Bhutanese | 99.9 /100 | #61 | Exceptional 2.3% |
| Immigrants | Europe | 99.9 /100 | #62 | Exceptional 2.3% |
| Laotians | 99.9 /100 | #63 | Exceptional 2.3% |
| Immigrants | Greece | 99.9 /100 | #64 | Exceptional 2.3% |
| Paraguayans | 99.9 /100 | #65 | Exceptional 2.3% |
| Argentineans | 99.9 /100 | #66 | Exceptional 2.3% |
| Zimbabweans | 99.8 /100 | #67 | Exceptional 2.3% |
| Immigrants | Kazakhstan | 99.8 /100 | #68 | Exceptional 2.3% |
| Carpatho Rusyns | 99.8 /100 | #69 | Exceptional 2.3% |
| Lithuanians | 99.8 /100 | #70 | Exceptional 2.3% |
| Immigrants | Bolivia | 99.8 /100 | #71 | Exceptional 2.3% |
| Immigrants | Canada | 99.8 /100 | #72 | Exceptional 2.3% |
| Immigrants | Bulgaria | 99.8 /100 | #73 | Exceptional 2.3% |
| Immigrants | North America | 99.8 /100 | #74 | Exceptional 2.2% |
Demographics Similar to Cherokee by Doctorate Degree
In terms of doctorate degree, the demographic groups most similar to Cherokee are Cajun (1.5%, a difference of 0.17%), Malaysian (1.5%, a difference of 0.18%), Jamaican (1.5%, a difference of 0.21%), Central American (1.5%, a difference of 0.24%), and British West Indian (1.5%, a difference of 0.29%).
| Demographics | Rating | Rank | Doctorate Degree |
| Marshallese | 0.4 /100 | #279 | Tragic 1.5% |
| Ecuadorians | 0.4 /100 | #280 | Tragic 1.5% |
| Tohono O'odham | 0.4 /100 | #281 | Tragic 1.5% |
| British West Indians | 0.3 /100 | #282 | Tragic 1.5% |
| Central Americans | 0.3 /100 | #283 | Tragic 1.5% |
| Jamaicans | 0.3 /100 | #284 | Tragic 1.5% |
| Malaysians | 0.3 /100 | #285 | Tragic 1.5% |
| Cherokee | 0.3 /100 | #286 | Tragic 1.5% |
| Cajuns | 0.3 /100 | #287 | Tragic 1.5% |
| Immigrants | El Salvador | 0.3 /100 | #288 | Tragic 1.4% |
| Cape Verdeans | 0.3 /100 | #289 | Tragic 1.4% |
| Choctaw | 0.3 /100 | #290 | Tragic 1.4% |
| Blacks/African Americans | 0.3 /100 | #291 | Tragic 1.4% |
| Alaska Natives | 0.3 /100 | #292 | Tragic 1.4% |
| Immigrants | Yemen | 0.2 /100 | #293 | Tragic 1.4% |